
Strategic Market Intelligence — Analysis Series. Prepared by Jim Ikpehai, Mediology Nigeria. Published March 2026.
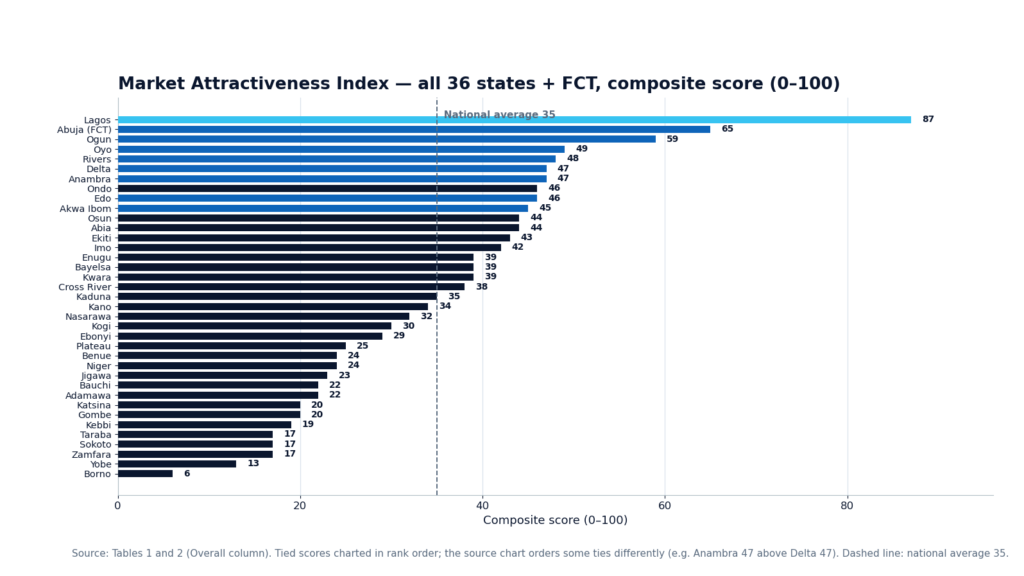
Lagos scores 87 on Mediology’s Market Attractiveness Index — 22 points clear of Abuja (65) and nearly seven times the weakest market — while the top five states carry 60% of Nigeria’s total market attractiveness. This Nigeria market attractiveness index scores all 36 states plus the FCT on six indices — Purchasing Power Parity, Affordability, Investment Stability, Market Stability, Economic Readiness and the composite Market Attractiveness Index — and sorts them into portfolio tiers: nine Invest/Grow (Leader) states to prioritize, three Emerging markets to build, and fifteen Harvest/Divest markets to exit or harvest. The South West leads every region at 54.7; the North East trails at 16.8.
| Measure | Value |
|---|---|
| Top market score | 87 — Lagos State |
| Total population | 222.6M |
| Markets scored | 37 (36 states + FCT) |
| Indices applied | 6 |
| Invest/Grow (Leader) states | 9 |
| South West average | 54.7 |
| North East average | 16.8 |
Executive summary
Two Nigerias — and the gap between them is the strategy
This analysis evaluates all 36 Nigerian states plus the FCT across six market indices — Purchasing Power Parity, Affordability, Investment Stability, Market Stability, Economic Readiness and the composite Market Attractiveness Index. It reveals significant regional disparities: the South West and South South lead on market attractiveness, while the North East faces substantial challenges rooted in security concerns and infrastructure gaps.
9 prime markets — States classified Invest/Grow (Leader) under the GE-McKinsey framework — the highest-priority investment targets.
15 Star states — High growth, high share under the BCG Matrix — warrant continued investment to defend leadership.
15 states to exit — Harvest/Divest positions — minimize new investment, maximize cash extraction, plan exits.
Strategic insights
Market concentration: the top 5 states represent 60% of total market attractiveness. Regional divide: the South West averages 54.7 against the North East’s 16.8. Digital divide: internet penetration ranges from 23% (Yobe) to 87% (Lagos). Consumer base: the middle class is 30% of the population, concentrated in southern states.
The bottom line
Nigeria is not one market but thirty-seven. Companies should prioritize the nine Invest/Grow (Leader) states, maintain selective presence in emerging markets, and treat the rest as harvest or niche plays — capital follows attractiveness, not geography.
Methodology & frameworks
Six indices, two frameworks, one composite score
Every state is scored on five independent indices, then weighted into a single Market Attractiveness Index. Two strategic frameworks — BCG Growth-Share and GE-McKinsey — convert the scores into portfolio decisions.
Purchasing Power Parity (PPP) — Components: GDP per capita (50%), cost of living via PMS price (30%), middle-class ratio (20%). Purpose: relative purchasing power adjusted for local cost of living.
Affordability Index — Components: GDP/PMS price ratio (40%), middle class % (30%), inverse inflation (30%). Purpose: consumer ability to purchase goods and services.
Investment Stability Index — Components: internet (25%), banking (25%), inverse crime (25%), GDP growth (25%). Purpose: environment stability for business investment.
Market Stability Index — Components: inverse inflation (30%), unemployment (30%), GDP growth (20%), population (20%). Purpose: economic predictability and consistency.
Economic Readiness Score — Components: internet (30%), banking (25%), industrial density (25%), GDP per capita (20%). Purpose: infrastructure and human-capital readiness.
Market Attractiveness Index — Formula: PPP (20%) + Affordability (15%) + Investment Stability (20%) + Market Stability (20%) + Economic Readiness (25%). Purpose: the composite score for market prioritization.
Applied frameworks
BCG Growth-Share Matrix classifies states by market growth and relative share — 15 Stars, 4 Cash Cows, 5 Question Marks, 13 Dogs. GE-McKinsey Matrix prioritizes markets by industry attractiveness and business strength — 9 Invest/Grow (Leader), 3 Strong, 3 Emerging, 7 Selectivity/Earnings, 15 Harvest/Divest.
Market Attractiveness Index
Lagos scores 87 — one market in a league of its own
The composite index ranks every market on purchasing power, affordability, stability and readiness. Lagos (87) leads Abuja (65) by 22 points — and sits nearly seven times above the weakest market.
The fifteen markets that carry the country
| Rank | State | Region | Pop. | GDP/Cap | PPP | Afford. | Inv. Stab. | Mkt Stab. | Econ. Rd. | Overall | GE Tier |
|---|---|---|---|---|---|---|---|---|---|---|---|
| 1 | Lagos | South West | 16.5M | ₦3.7M | 98 | 82 | 78 | 71 | 100 | 87 | Leader |
| 2 | Abuja (FCT) | North Central | 4.2M | ₦2.5M | 73 | 64 | 67 | 50 | 69 | 65 | Leader |
| 3 | Ogun | South West | 6.3M | ₦0.7M | 54 | 51 | 66 | 67 | 55 | 59 | Leader |
| 4 | Oyo | South West | 8.1M | ₦0.5M | 44 | 41 | 56 | 60 | 45 | 49 | Leader |
| 5 | Rivers | South South | 8.2M | ₦1.0M | 49 | 46 | 53 | 41 | 49 | 48 | Leader |
| 6 | Delta | South South | 6.2M | ₦1.0M | 49 | 49 | 47 | 49 | 42 | 47 | Leader |
| 7 | Anambra | South East | 6.5M | ₦0.7M | 41 | 49 | 46 | 57 | 41 | 47 | Leader |
| 8 | Ondo | South West | 5.3M | ₦0.9M | 47 | 56 | 39 | 67 | 30 | 46 | Selective |
| 9 | Edo | South South | 5.1M | ₦0.7M | 46 | 48 | 46 | 58 | 36 | 46 | Leader |
| 10 | Akwa Ibom | South South | 6.1M | ₦1.3M | 47 | 51 | 46 | 48 | 35 | 45 | Leader |
| 11 | Osun | South West | 5.2M | ₦0.5M | 44 | 45 | 49 | 62 | 25 | 44 | Emerging |
| 12 | Abia | South East | 4.3M | ₦0.7M | 46 | 47 | 39 | 55 | 35 | 44 | Strong |
| 13 | Ekiti | South West | 3.6M | ₦0.7M | 44 | 44 | 47 | 61 | 25 | 43 | Emerging |
| 14 | Imo | South East | 5.9M | ₦1.2M | 46 | 52 | 34 | 50 | 34 | 42 | Strong |
| 15 | Enugu | South East | 4.8M | ₦0.3M | 32 | 36 | 42 | 55 | 30 | 39 | Selective |
Market concentration
The top 5 states — Lagos, Abuja, Ogun, Oyo and Rivers — represent 60% of total market attractiveness. Lagos alone combines the highest PPP (98), a perfect economic-readiness score (100) and GDP per capita of ₦3.7M, roughly five times the national norm.
BCG matrix — portfolio analysis
Invest where growth and share already meet
The BCG Growth-Share Matrix classifies all 37 markets on market growth rate and relative market share — clarifying where to invest, where to milk, and where to walk away.
Stars · 15 states (40%)
High growth, high share — invest heavily to maintain leadership.
Lagos, Abuja, Ogun, Oyo, Rivers, Delta, Anambra, Ondo, Edo, Akwa Ibom, Abia, Imo, Benue, Cross River, Kogi.
Cash Cows · 4 states (11%)
Low growth, high share — maximize returns, limit investment.
Kaduna, Kano, Bayelsa, Niger.
Question Marks · 5 states (14%)
High growth, low share — selective investment or divestment.
Ebonyi, Enugu, Kebbi, Kwara, Nasarawa.
Dogs · 13 states (35%)
Low growth, low share — divest or niche strategies.
Adamawa, Bauchi, Borno, Ekiti, Gombe, Jigawa, Katsina, Osun, Plateau, Sokoto, Taraba, Yobe, Zamfara.
Portfolio implications
Stars (40%) require continued investment to defend leadership as growth continues. Cash Cows (11%) generate steady returns with limited growth — optimize operations. Question Marks (14%) are high-risk, high-reward — evaluate carefully before committing. Dogs (35%) warrant market exit or minimal presence unless a niche opportunity exists.
What the portfolio says
More than half of Nigeria’s markets — 20 of 37 — sit in Star or Cash Cow territory. The investable core is broad enough for national scale, but capital should concentrate where both growth and share are already proven.
GE-McKinsey prioritization matrix
Nine markets earn the right to lead investment
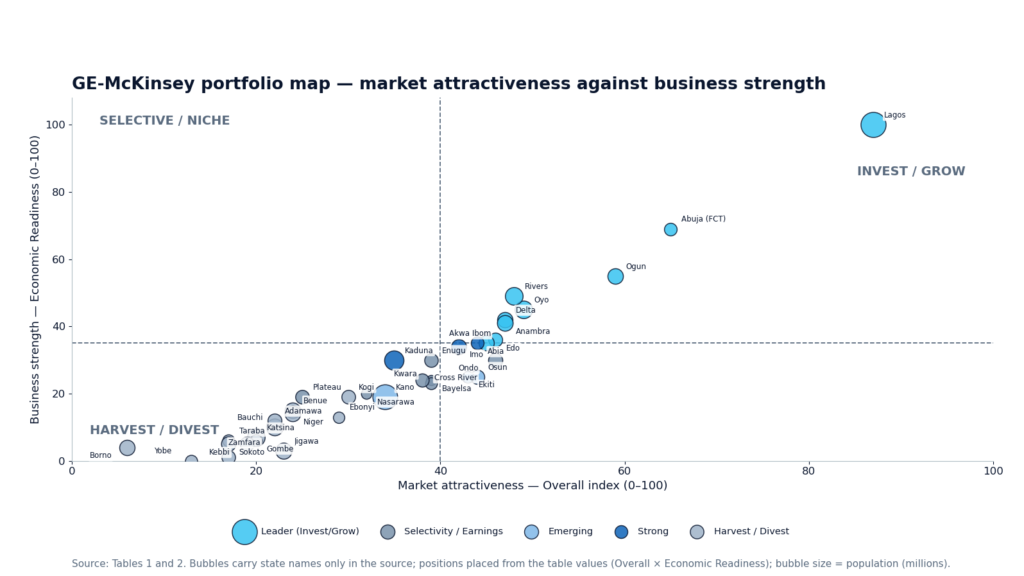
The GE-McKinsey Matrix scores every market on industry attractiveness against business strength — producing a five-tier prioritization for capital allocation.
Invest/Grow — Leader · 9
Highest priority for investment.
Lagos, Abuja, Ogun, Oyo, Rivers, Delta, Anambra, Edo, Akwa Ibom.
Invest/Grow — Strong · 3
Strong competitive position.
Abia, Imo, Kaduna.
Invest/Grow — Emerging · 3
High potential, developing strength.
Ekiti, Kano, Osun.
Selectivity and harvest
Selectivity/Earnings (7 states — 19%): Bayelsa, Cross River, Enugu, Kwara, Nasarawa, Ondo, Plateau — targeted investments, profitable segments only, selective presence. Harvest/Divest (15 states — 41%): minimize new investments, maximize cash extraction, plan exit strategies. Invest/Grow tiers together cover 40% of states and deserve maximum resource allocation.
Regional market analysis
South West leads on every measure that matters
Performance by geopolitical zone exposes the structural divide: attractiveness, purchasing power and middle-class concentration all slope southward.
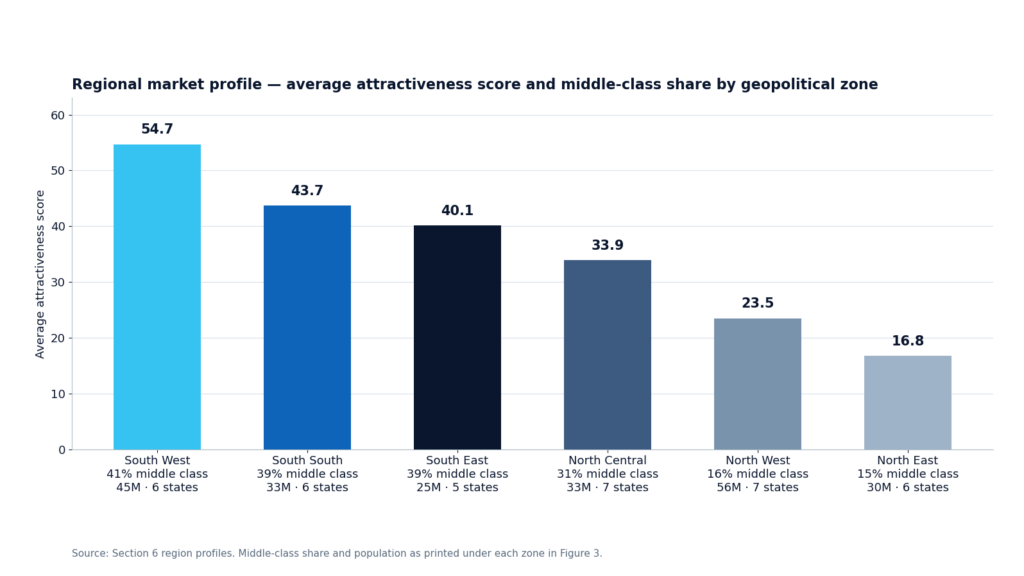
South West · 54.7
6 states · 45M people · 41% middle class. Dominates attractiveness and consumer depth.
South South · 43.7
6 states · 33M people · 39% middle class. Oil economy drives GDP per capita and purchasing power.
South East · 40.1
5 states · 25M people · 39% middle class. Entrepreneurial culture supports trade and business activity.
North Central · 33.9
7 states · 33M people · 31% middle class. Abuja (FCT) significantly lifts regional performance.
North West · 23.5
7 states · 56M people · 16% middle class. Largest population, lower development indicators.
North East · 16.8
6 states · 30M people · 15% middle class. Security challenges severely impact attractiveness.
Consumer shifts & opportunities
The wallet is moving home, digital and essential
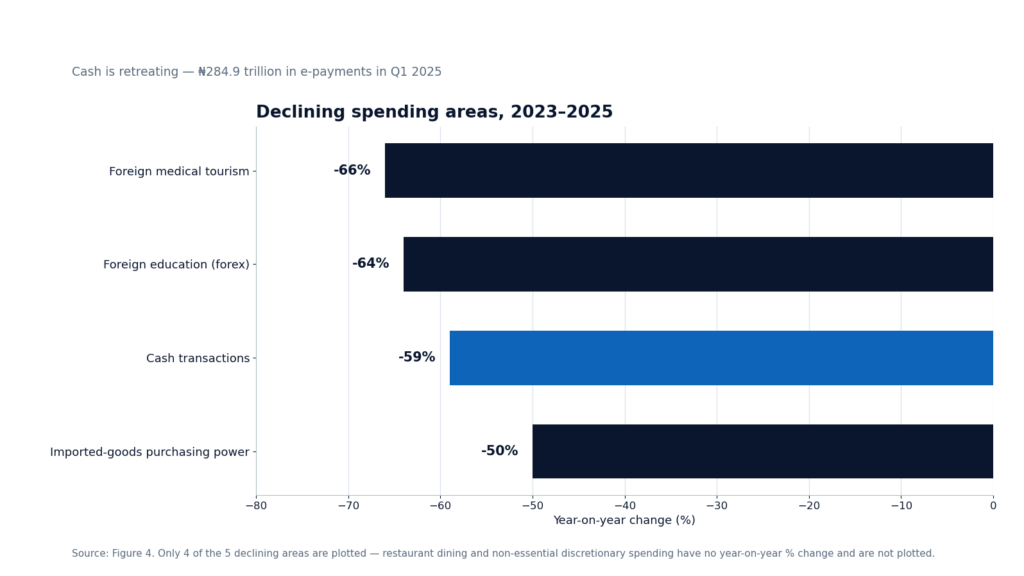
Between 2023 and 2025 the Nigerian consumer rewired spending: away from imports, foreign services and cash — toward digital finance, domestic healthcare and education, and essential goods.
Growing spending areas · 2026–2030
- Digital financial services — ₦284.9T in e-payments in Q1 2025; cash down 59%
- Local healthcare — medical tourism collapsed 66% YoY; domestic care expanding
- Domestic education — forex education spend down 64%; local institutions growing
- Essential food items — affordable protein, bulk purchasing, home cooking
- Communication services — $14.15 per capita in 2025, growing steadily
Declining spending areas
- Foreign medical tourism — spending collapsed from $2.3M to near zero
- Foreign education — 64% drop in forex spending on overseas tuition
- Imported goods — purchasing power for imports halved, 2023–2024
- Restaurant dining — per-capita spend forecast at just $1.50 in 2025
- Non-essential discretionary — household items at $32.76 per capita
Where the opportunity sits
Brands that localize supply chains, price in naira for the domestic wallet, and distribute through digital channels are aligned with the strongest currents in Nigerian consumer spending through 2030.
State rankings & tiers
The readiness gap is the widest gap of all
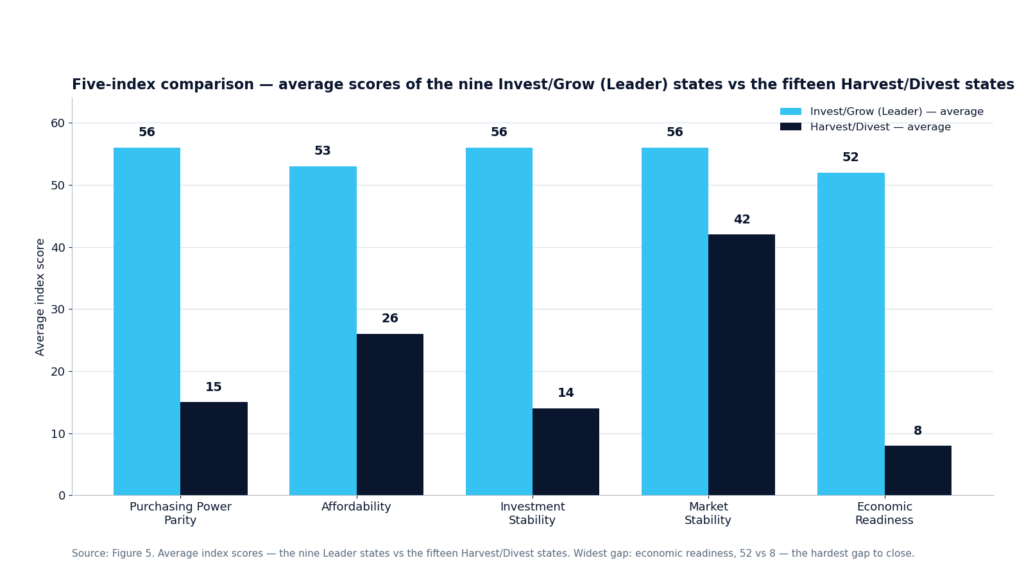
Averaged across the five indices, the nine Leader states outscore the fifteen Harvest/Divest states on every dimension — and the widest separation is economic readiness (52 vs 8), the hardest gap to close.
| Rank | State | Region | Pop. | PPP | Afford. | Inv. Stab. | Mkt Stab. | Econ. Rd. | Overall | Priority |
|---|---|---|---|---|---|---|---|---|---|---|
| 16 | Bayelsa | South South | 2.7M | 52 | 47 | 37 | 40 | 24 | 39 | Selective |
| 17 | Kwara | North Central | 3.7M | 38 | 42 | 30 | 65 | 23 | 39 | Selective |
| 18 | Cross River | South South | 4.6M | 39 | 49 | 28 | 55 | 24 | 38 | Selective |
| 19 | Kaduna | North West | 9.8M | 27 | 38 | 30 | 49 | 30 | 35 | Strong |
| 20 | Kano | North West | 16.1M | 21 | 34 | 46 | 52 | 19 | 34 | Emerging |
| 21 | Nasarawa | North Central | 2.9M | 34 | 37 | 29 | 44 | 20 | 32 | Selective |
| 22 | Kogi | North Central | 4.9M | 39 | 29 | 20 | 45 | 19 | 30 | Divest |
| 23 | Ebonyi | South East | 3.4M | 22 | 30 | 24 | 59 | 13 | 29 | Exit |
| 24 | Plateau | North Central | 4.9M | 27 | 22 | 21 | 35 | 19 | 25 | Selective |
| 25 | Benue | North Central | 6.3M | 26 | 20 | 18 | 39 | 15 | 24 | Divest |
| 26 | Niger | North Central | 6.4M | 31 | 26 | 15 | 34 | 14 | 24 | Divest |
| 27 | Jigawa | North West | 6.8M | 7 | 31 | 30 | 50 | 3 | 23 | Divest |
| 28 | Bauchi | North East | 7.4M | 15 | 27 | 19 | 45 | 10 | 22 | Divest |
| 29 | Adamawa | North East | 5.1M | 14 | 31 | 14 | 44 | 12 | 22 | Exit |
| 30 | Katsina | North West | 8.1M | 15 | 31 | 9 | 44 | 7 | 20 | Exit |
| 31 | Gombe | North East | 3.8M | 16 | 27 | 17 | 38 | 6 | 20 | Exit |
| 32 | Kebbi | North West | 5.2M | 9 | 16 | 25 | 41 | 5 | 19 | Divest |
| 33 | Taraba | North East | 3.8M | 10 | 25 | 7 | 44 | 6 | 17 | Exit |
| 34 | Sokoto | North West | 5.5M | 11 | 28 | 5 | 41 | 5 | 17 | Exit |
| 35 | Zamfara | North West | 4.8M | 9 | 31 | 1 | 51 | 1 | 17 | Exit |
| 36 | Yobe | North East | 3.9M | 3 | 29 | 0 | 40 | 0 | 13 | Exit |
| 37 | Borno | North East | 6.2M | 4 | 5 | 6 | 15 | 4 | 6 | Exit |
Strategic recommendations
Enter deep where you lead, partner where you grow
Market entry and investment strategy follows the tiers: immediate, full-commitment entry into the five anchor markets; structured 12–24 month build-out across the growth corridor.
Tier 1 · Priority markets — immediate entry
- Lagos — premium focus, digital-first approach, high-value products
- Abuja — government/B2B focus, professional services, corporate clients
- Ogun — industrial corridor, manufacturing partnerships, logistics hub
- Oyo — large consumer base, agricultural value chain, education sector
- Rivers — oil & gas services, port logistics, energy sector
Tier 2 · Growth markets — 12–24 months
- Delta, Anambra, Edo — regional hubs, trade & commerce focus
- Akwa Ibom — oil-economy leverage, infrastructure development
- Abia, Imo — manufacturing & trade, SME support
- Osun, Ekiti — education & services, government partnerships
Key success factors
Localization: adapt products to local preferences and purchasing power. Digital distribution: leverage high internet penetration in target markets. Partnerships: collaborate with local distributors and financial institutions. Flexible pricing: tiered pricing for different consumer segments. Supply-chain resilience: local sourcing to reduce forex exposure. Regulatory compliance: navigate state-level business regulations effectively.
Resource allocation
Invest/Grow tiers cover 40% of states — allocate maximum resources, expand presence, build competitive advantage. Selectivity markets (19%) earn targeted investment in profitable segments only. Harvest/Divest markets (41%) get minimal new capital while cash is extracted and exits are planned.
Conclusion
Prioritize the nine. Watch the emerging three.
The Nigeria market landscape presents a dichotomy of opportunities: the South West and South South offer attractive investment environments with strong consumer bases and improving infrastructure, while the North East and parts of the North West face significant challenges requiring careful risk assessment.
Concentration is real
Five states carry 60% of national market attractiveness. Lagos is not just first — it is in a category of its own at 87.
The divide is economic
South West averages 54.7 against the North East’s 16.8 — a gap rooted in infrastructure, security and readiness.
Readiness decides
Economic readiness separates Leaders from Exit states 52 to 8 — the widest and hardest gap to close.
The consumer moved
Spending is going digital, domestic and essential. Strategies built on imports and cash are swimming against the current.
Strategic conclusion
Success in Nigeria requires a nuanced, state-level approach that accounts for regional variations in purchasing power, digital readiness and investment stability. Prioritize the nine Invest/Grow (Leader) states, build the three Emerging markets, and maintain selective presence elsewhere. Companies that match capital to attractiveness will capture a disproportionate share of Nigeria’s next growth cycle.
Data sources: National Bureau of Statistics · Central Bank of Nigeria · World Bank · PEBEC Ease of Doing Business Report 2025. Analysis date: March 2026 · Methodology: multi-factor scoring model with BCG and GE-McKinsey frameworks.
About the author
Jim Ikpehai Managing Consultant · Mediology Nigeria Limited, Lagos
Results-driven marketing communications strategist with over 15 years of experience in brand building, brand development and management. A trusted consultant to global and local brands including Samsung, Reliance HMO, Polo Swarovski, FBN Holdings, M-KOPA, Honda Nigeria, Daraju Industries and De Trans — delivering 360° marketing, communication strategies, media planning and buying, digital marketing, SEO, content strategy and marketing analytics.
Education
- Ph.D. Economics — Sustainable Growth & Development (in view), University of Lagos
- M.Sc. Economics — Growth & Development, Monetary & Energy Economics, University of Lagos
- B.Sc. Economics — University of Lagos
- Level 6 Diploma in Strategic Marketing — Chartered Institute of Marketing (CIM), UK
Career highlights
- Managing Consultant — Mediology Nigeria Ltd (2025–present)
- Director of Planning & Strategy — Solid Media Nigeria (2022–2025)
- Head, Media Planning & Strategy — HoiSales Nigeria (2020–2022)
- Head, Planning / Insight & Analytics — All Seasons Zenith (Publicis Groupe), Lagos (2014–2020)
- Senior Manager, Research / Planning & Innovation — All Seasons Zenith (Publicis), 2013–2014
- Manager, Data Analytics & Innovation — MediaCom (WPP), 2011–2013
Memberships & recognition
- Juror, Young Lions National Competition (Cannes Lions pathway) — 2024 & 2025
- Juror, Pitcher Awards — 2024
- Panelist, Social Media Week Lagos — 2019
- Fellow, Institute of Management Consultants of Nigeria (FIMC)
- Associate Member, Advertising Practitioners Council of Nigeria (APCON)
- Member, Chartered Institute of Marketing (CIM), UK
15+ years in marketing communications · WPP · Publicis global network experience · ALAT launch team — Nigeria’s first digital bank · 2× Young Lions Juror · 2024 & 2025
jim@mediologyng.com · +234 703 630 0230 · linkedin.com/in/jimikpehai75564295
See our Services page for the six integrated disciplines behind this approach.
Frequently asked questions
What is the Market Attractiveness Index and how is it calculated?
The Market Attractiveness Index is a composite score built from five indices — Purchasing Power Parity (20%), Affordability (15%), Investment Stability (20%), Market Stability (20%) and Economic Readiness (25%) — and applied to all 36 states plus the FCT to rank markets for investment prioritization.
Which state should a business enter first in Nigeria?
Lagos. It scores 87 on the Market Attractiveness Index — 22 points clear of Abuja (65) — with the highest PPP (98), a perfect economic-readiness score (100) and GDP per capita of ₦3.7M, roughly five times the national norm.
Which are the nine Invest/Grow (Leader) states?
Lagos, Abuja (FCT), Ogun, Oyo, Rivers, Delta, Anambra, Edo and Akwa Ibom. Together with the three Strong and three Emerging states, the Invest/Grow tiers cover 40% of states and deserve maximum resource allocation.
Where is the gap between leading and lagging markets widest?
Economic readiness: the nine Leader states average 52 against 8 for the fifteen Harvest/Divest states — the widest and hardest gap to close. Regionally, the South West averages 54.7 against the North East’s 16.8.
Where can I get the full report?
The full 15-page Nigeria Market Landscape — State-Level Prioritization & Attractiveness Index is available to download below. For a tailored reading of the findings for your business, or a state-level deep dive, contact Mediology Nigeria at info@mediologyng.com or visit 1 Montgomery Road, Yaba, Lagos.
This report was prepared by Jim Ikpehai, Mediology Nigeria — data-driven marketing communications excellence. For the full analysis, including every market ranking and the underlying data, download the complete report below.