
Nigeria’s next property advantage will be earned through proof
The market remains investable, but trust and affordability now determine which demand becomes bankable absorption.
Nigeria does not have a demand story without a credibility problem; it has a credibility problem sitting inside an extraordinary demand story. This edition examines both. It connects macroeconomic evidence, state-level attractiveness, investment risk and trust-centred brand strategy in one decision system.
The decision: back markets and business models where structural demand can be converted into verifiable, financeable and deliverable value.
Macroeconomic conditions are improving, but household affordability and capital costs remain restrictive. The winning thesis is therefore not “build more premium stock”. It is to solve a specific demand–affordability–trust equation by geography and asset logic.
The market in four numbers
| Indicator | Value | Reference period |
|---|---|---|
| Real estate share of real GDP | 12.71% | Q2 2026 |
| Estimated housing deficit | 14.925 million units | 2025 |
| Real estate growth, year on year | 3.76% | Q2 2026 |
| Monetary Policy Rate | 23.0% | September 2026 |
Five findings
- 1. The opportunity is structural; absorption is not automatic. Housing need coexists with weak purchasing power, expensive credit and product–price mismatch.
- 2. Trust is an economic variable. Title uncertainty, payment exposure, construction quality, delivery delays and opaque charges increase verification costs and weaken conversion.
- 3. Geography requires portfolio logic. Lagos leads the MAI; Ogun, Rivers, Oyo and Anambra follow. The FCT is attractive but demand scale is narrower than the largest urban markets.
- 4. The largest whitespace may sit beside property, not only in it. Verification, escrow coordination, independent inspection, transparent rental operations and asset assurance can monetise the trust gap.
- 5. Repositioning without operating reform will fail. Communications must publish evidence, not amplify promises.
Recommended portfolio posture
Prioritise: mid-market compact homes, transparent rental operations, logistics in proven corridors, student/workforce living near real institutions, and trust infrastructure.
Be selective: prime residential, hospitality, land banking and off-plan development. Require stronger pre-sales, clean title, downside resilience and credible exits.
Avoid as a default: unverified land, inventory built only for nominal appreciation, unhedged FX obligations, and campaigns that claim “trusted” without third-party proof.
First three moves
- 1. Choose two state–segment combinations and validate absorption.
- 2. Build a six-layer proof system before launch.
- 3. Baseline buyer trust, delivery performance and complaint resolution; publish progress.
Sources: National Bureau of Statistics (2026a, 2026b); Central Bank of Nigeria (2026); Federal Ministry of Information and National Orientation (2026); Mediology analysis.
Investment thesis in five numbers
Five numbers explain the opportunity — and its constraint. Scale attracts attention. Deliverability, affordability and proof determine outcomes.
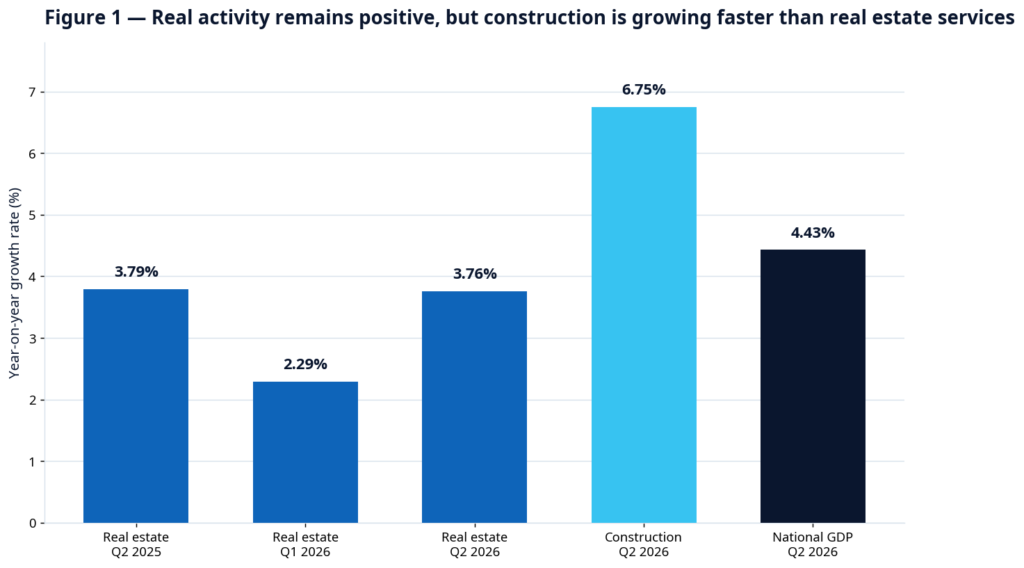
Source: National Bureau of Statistics Q2 2026 GDP data as reported by AllAfrica (2026); growth rates are year on year.
Demand
The 14.925 million-unit deficit estimate confirms structural need. It is not equivalent to effective demand for formal private developments.
Capital
Inflation eased to 14.63% in September 2026 and the MPR to 23%, yet real financing hurdles remain high. Underwrite real, not nominal, returns.
Confidence
Over 90% of land was reported as unregistered in the 2024 federal land-modernisation announcement. Verification and registration are core market infrastructure.
The Trust Premium thesis
When a developer reduces information asymmetry and protects the buyer’s downside, it can lower sales friction, improve financing readiness and differentiate without relying on discounting.
- 1. Verify — title, identity, approvals.
- 2. Protect — payments, milestones, remedies.
- 3. Prove — quality, progress, delivery.
- 4. Repair — complaints, delays, recovery.
Boundary: trust mechanisms reduce specified risks; they do not eliminate market, title, construction, regulatory or liquidity risk.
Method and evidence protocol
A screening model — not a substitute for due diligence. Transparency about what the evidence can and cannot support is part of the journal’s trust standard.
Research design
This is a secondary-data strategic review combined with a proprietary screening model built from the supplied state dataset. It follows an evidence hierarchy: official statistics and law first; institutional and professional research second; reputable market reporting third; explicit Mediology judgement for scores and strategic options.
Analytical stack
| Question | Framework | Output |
|---|---|---|
| What shapes the sector? | PESTEL · 5C · value chain | Constraints and strategic implications |
| How does competition behave? | Porter · SWOT–TOWS | Pressure points and choices |
| Why does trust fail? | ABI trust model · journey · JTBD | Failure moments and proof needs |
| Where is opportunity stronger? | Weighted percentile MAI · segment indices | State and asset screening |
| What can destroy value? | Risk heat map · sensitivity | Mitigation and investment gates |
| How is trust rebuilt? | STP · positioning · PESO · service recovery | Proof-led repositioning |
MAI construction
Five pillars, 21 indicators, 100 points: demand scale 25; economic depth 20; growth momentum 15; infrastructure and nodes 20; operating conditions 20. Indicators are converted to percentile scores across 37 markets; inverse indicators are reversed. Weighted scores are relative, not probabilities of success.
| Pillar | Weight | Indicators and rationale |
|---|---|---|
| Demand scale | 25 | Affluent + middle-class population 12.5; population 5; open-market trade 7.5 |
| Economic depth | 20 | State GDP 10; GDP per capita 5; IGR per capita 5 |
| Growth momentum | 15 | Real GDP growth 7.5; population growth 7.5 |
| Infrastructure & nodes | 20 | Industrial density 5; retail chains 4; hotels 3; internet 3; higher institutions 2; vehicles 2; airports 1 |
| Operating conditions | 20 | Banking access 5; literacy 4; inverse unemployment 4; inverse crime fatalities per million 4; inverse inflation 3 |
Calculation: each indicator is ranked across the 37 markets and converted to a 0–100 percentile. Inverse indicators are reversed. Weighted pillar scores sum to MAI. Risk band uses the operating-condition score: lower ≥65; moderate 50–64.9; elevated 35–49.9; high <35.
Weighting logic: demand and economic depth carry 45 points because property absorption requires people and purchasing power. Growth and nodes capture future demand and asset-use drivers. Operating conditions prevent scale from overwhelming execution realities.
Read the score correctly: 96.9 does not mean a 96.9% return or success probability. It means Lagos has the strongest relative position across this particular indicator and weighting system.
Required next step: run local absorption, price, title, infrastructure, security and competitor-supply studies for the shortlisted state–segment pair.
Quality controls
- No supplied field treated as an official census or valuation.
- No implied precision beyond one decimal place.
- Risk presented separately from attractiveness.
- Scenario outputs indexed, not presented as actual IRR.
- Missing nationally representative trust data disclosed.
Limitations
State data do not capture city, corridor or asset-level variation. Crime, hotel, airport and business counts are proxies. Dataset provenance was not independently audited. MAI is suitable for screening and hypothesis generation — not acquisition approval.
Section 01 — Situation and trust diagnosis
The sector’s growth story is real. So is the friction between promise and proof. This section maps the forces, actors and failure moments shaping investability.
Sector value chain: trust risk migrates across the entire asset life cycle
A clean sales brochure cannot compensate for uncertainty introduced upstream — or weak stewardship after handover.
| Value stage | Trust failure | Economic consequence | Proof required |
|---|---|---|---|
| Land & title | Competing claims; unregistered interests; misleading title shorthand | Legal cost, delay, total loss | Independent registry search; survey validation; consent path |
| Capital & design | Weak cost plan; approvals treated as administrative afterthoughts | Funding gap, redesign, compliance stoppage | Approved drawings; BoQ; contingency; funding evidence |
| Build & sell | Escrow absence; render–reality gap; vague delivery dates | Buyer anxiety, cancellations, claims | Milestone account; inspection; specification schedule |
| Operate & exit | Opaque service charge; poor maintenance; incomplete handover | Arrears, reputation loss, weak resale | Handover file; audited charges; asset register; defects SLA |
Framework: Mediology value-chain analysis; regulatory context from G. Elias (2022) and Federal Ministry of Housing and Urban Development (2024).
Macro and sector performance: stabilisation helps planning; it has not removed the affordability constraint
The property thesis must survive high capital costs and cautious household spending.
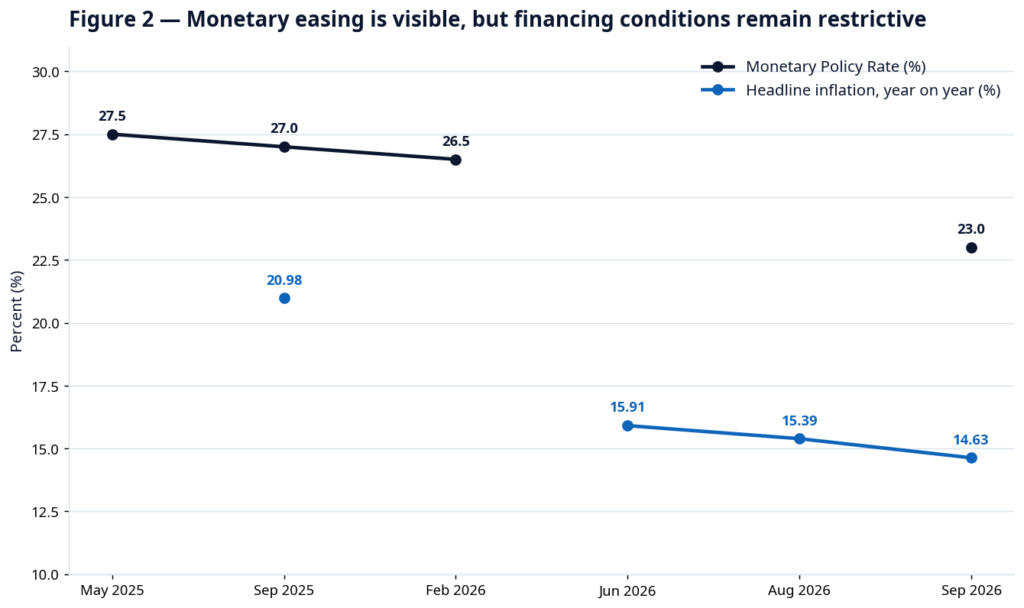
Sources: Central Bank of Nigeria (2026); National Bureau of Statistics (2026b); PwC Nigeria (2026) for June inflation.
Transmission into property:
- Debt: high reference rates raise development and mortgage hurdles.
- Costs: disinflation slows price growth; it does not reverse prior cost escalation.
- Demand: essential spending competes with deposits, rent and service charges.
- FX: improved stability supports planning, but imported-input exposure remains.
Investment implication: use scenario-based hurdle rates, fixed-price procurement where feasible, local-material substitution without quality compromise, and sales assumptions tied to verified income segments. Do not translate a falling inflation rate into an automatic recovery in housing affordability.
Structural demand: the deficit is enormous; the bankable market must still be built
Demand becomes investable only when product, price, place, finance and proof align.
| Indicator | Value | Reference |
|---|---|---|
| Housing units deficit estimate | 14.925m | 2025 |
| Land reported unregistered | >90% | 2024 federal announcement |
| Nigeria population living in cities | 55.7% | UN 2025 estimate |
| Daily cost of a healthy diet per adult | ₦1,589 | April 2026 |
Need ≠ effective demand. The deficit estimate is based on persons per room and housing adequacy. It describes a social and physical need, not an order book for commercially priced units. Effective demand depends on income, financing, location, tenure preference, total occupancy cost and trust.
Urbanisation creates multiple asset logics. Urban growth supports rental housing, workforce accommodation, daily-needs retail, logistics, healthcare, education and managed living. The opportunity is a system of urban services — not a single residential product.
Affordability is a design brief. Smaller efficient units, phased infrastructure, durable low-maintenance specifications, transparent service charges and appropriate payment structures can widen the addressable market. Affordability should be assessed against total cost of occupancy, not headline price alone.
Demand conversion filter — five questions:
- 1. How many target households can pay without unsustainable leverage?
- 2. Is the location linked to employment, transport and services?
- 3. Does the unit mix reflect household size and income?
- 4. Are title, delivery and payment protections credible?
- 5. What is the total monthly cost after service charge and utilities?
Sources: Federal Ministry of Information and National Orientation (2026); Federal Ministry of Housing and Urban Development (2024); United Nations DESA (2025); PwC Nigeria (2026). UN settlement-category estimates are not directly comparable with older “urban population” series.
PESTEL: formalisation is advancing unevenly across a high-cost operating environment
Macro reform creates a planning window; state-level execution determines whether assets become investable.
| Force | Evidence / situation | Strategic implication | Priority |
|---|---|---|---|
| Political | Land and housing are federal–state execution issues; reform commitments require local implementation. | Map the actual approval and title path by state; do not underwrite announcement timelines. | High |
| Economic | Real estate is large; inflation and MPR are easing but remain high; household budgets are pressured. | Stress-test absorption and real returns; prioritise capital-efficient formats. | High |
| Social | Urban growth, renting, household fragmentation and diaspora interest coexist with fraud anxiety. | Segment by income and job-to-be-done; offer verified remote purchase and transparent renting. | High |
| Technological | Digital registries, KYC, virtual inspection and escrow coordination can reduce information asymmetry. | Treat technology as a verification layer linked to authoritative records, not a trust slogan. | High |
| Environmental | Flooding, drainage, heat, power reliability and material resilience affect lifecycle value. | Require climate and site screening; disclose operating and resilience costs. | High |
| Legal | Land Use Act, state planning, LASRERA in Lagos, consumer protection and data rules intersect. | Create a compliance matrix with owners, evidence and expiry dates. | High |
| Regulatory trajectory | LASRERA registration, public registers and ADR signal formalisation; enforcement consistency matters. | Use registration as a minimum threshold, not proof of project quality. | Medium–high |
| Data environment | New housing-deficit work improves evidence; transaction and valuation data remain fragmented. | Fund primary demand research and independent valuation before scale. | Medium–high |
PESTEL synthesis: the decisive forces are institutional execution and household economics. Technology can accelerate trust only where records, professional accountability and remedies are real.
5C analysis: competitive advantage shifts from claim ownership to proof ownership
Customers buy reduced uncertainty as much as they buy land or space.
| Lens | What matters now | Strategic response |
|---|---|---|
| Customer | End-users, tenants, diaspora buyers, corporates and investors have different risk exposures. Common needs: valid title, delivery certainty, price clarity, quality and recourse. | Build separate propositions and evidence packs. Do not treat “buyers” as one segment. |
| Company | Developer credibility varies by delivered track record, capital structure, contractor governance and after-sales capability. | Audit proof before brand positioning. Close operational gaps that communications cannot solve. |
| Competitor | Competition includes formal developers, informal landowners, agents, listing platforms and alternative stores of wealth. | Differentiate on independently checkable outcomes, not generic luxury claims. |
| Collaborator | Banks, payment providers, lawyers, surveyors, engineers, insurers, regulators, community leaders and facility managers shape trust. | Contract roles, SLAs and escalation routes into the delivery system. |
| Context | Housing need and urbanisation are strong; affordability, security, infrastructure and regulation constrain conversion. | Select markets by state–segment fit and asset-level resilience, not national averages. |
Competitor proof benchmark:
- Weak proof: “Trusted”, “secure”, “guaranteed returns”, artist impressions, influencer reach, unverified testimonials.
- Strong proof: delivered-unit register, inspection reports, milestone account statements, title pack, complaints SLA, service-charge accounts.
5C verdict: the firm’s most defensible asset is not a visual identity or land inventory; it is a repeatable system for making and keeping property promises.
Porter’s Five Forces + complementors: the most important competitive outcome is reduced decision avoidance
Industry pressure rewards operators that can prove delivery and lower the buyer’s perceived downside.
| Force | Intensity | Why it matters | Winning response |
|---|---|---|---|
| Rivalry among developers | High | Fragmented supply, similar claims, location-led competition and periodic discounting compress differentiation. | Own a segment and publish delivery evidence; avoid undifferentiated premium stock. |
| Buyer power | High and rising | High ticket size, fraud anxiety and alternative options increase scrutiny and negotiation. | Offer comparison-ready documents, milestone payments and transparent total pricing. |
| Supplier / contractor power | Medium–high | Material volatility, specialist skills and imported inputs affect cost and programme. | Prequalify, dual-source, specify substitutions and link payment to inspected milestones. |
| Threat of new entrants | Medium | Sales-led entry can be easy; reliable delivery and compliance are harder. | Build barriers through data, delivery record, partnerships and operating discipline. |
| Threat of substitutes | High | Renting, family land, informal construction, financial assets and delayed purchase compete for capital. | Sell the use case and protection; show total occupancy economics and realistic alternatives. |
| Complementors / gatekeepers | Decisive | Registries, lenders, professionals, payment rails and communities can accelerate or block trust. | Design the partner ecosystem as part of the product. |
In a low-trust category, the strongest rival is often the customer’s decision to do nothing.
Strategic consequence: conversion content must answer risk objections before aspiration. “See the title pack” can be more persuasive than “own your dream”.
Portfolio consequence: recurring-revenue services — rental management, inspection, compliance and facility operations — can diversify development-cycle exposure.
SWOT–TOWS: the strategic choice is disciplined focus — not indiscriminate expansion
The sector’s strengths support growth only when structural weaknesses are deliberately engineered out.
Strengths:
- Large underlying housing and urban-services need
- Significant contribution to national output
- Multiple residential, logistics and operating models
- Strong entrepreneurial and diaspora interest
Weaknesses:
- Fragmented title and transaction data
- Thin long-term finance and affordability
- Variable delivery and construction governance
- Weak after-sales and complaint visibility
Opportunities:
- Trust infrastructure and independent assurance
- Mid-market rental and compact ownership
- Secondary-city and corridor specialisation
- Green retrofit and professional operations
Threats:
- Cost, FX and interest-rate shocks
- Fraud, building failure and regulatory action
- Security and climate exposure
- Oversupply in poorly researched niches
TOWS: convert diagnosis into choices
| Strategy | Choice |
|---|---|
| SO · Scale strengths into need | Use delivered track records and local partnerships to expand compact living, logistics and managed operations in high-MAI markets. |
| WO · Repair weaknesses to capture demand | Build title, escrow, inspection and reporting capabilities before scaling off-plan sales. |
| ST · Use strengths to reduce shocks | Diversify by asset logic and geography; secure supplier frameworks; maintain conservative leverage. |
| WT · Avoid compounded fragility | Exit opaque partnerships, weak-title land and products dependent on uninterrupted cost inflation or unrealistic pre-sales. |
The anatomy of trust: buyers need evidence of competence, character and care
The Mayer–Davis–Schoorman model becomes commercially useful when each dimension is attached to verifiable property proof.
Trust is the willingness to accept vulnerability in expectation of competent, fair and beneficial action. In property, the vulnerability is unusually large: savings, debt, safety, family security and time.
| Dimension | Question | Property proof |
|---|---|---|
| Ability | Can the organisation deliver the promised asset and service? | Delivered units · contractor record · quality inspections · programme reliability |
| Integrity | Does it keep commitments and apply acceptable principles consistently? | Valid title · plain contracts · honest advertising · transparent charges · remedies |
| Benevolence | Does it protect the customer’s interests when circumstances become difficult? | Delay support · responsive repairs · fair refunds · respectful recovery |
| Evidence | Can the customer verify claims without relying on the seller’s narrative? | Third-party records · accessible data · named accountable owners |
Trust is not a brand attribute. It is an evaluation formed from operational evidence and lived outcomes. Marketing can make evidence visible; it cannot manufacture the underlying truth.
The trust equation for this journal: perceived trustworthiness = demonstrated ability + integrity + benevolence × independent verifiability − unresolved failure exposure. A strategic heuristic, not an econometric formula.
Trust dimensions adapted from Mayer, Davis and Schoorman (1995). Evidence layer and property application: Mediology analysis.
Trust deficit: evidence and measurement
The deficit is visible in transaction friction — not in an invented national percentage. Institutional failures and consumer-protection mechanisms provide stronger evidence than unsupported sentiment claims.
| Indicator | Value | Source |
|---|---|---|
| Building-collapse incidents listed | 26 | 2025 COREN record |
| Deaths in that published 2025 record | 32 | 2025 COREN record |
| Injuries in that published 2025 record | 104 | 2025 COREN record |
| Land reported unregistered | >90% | 2024 federal announcement |
Six mutually reinforcing deficits:
- 1. Information deficit: buyers cannot easily verify ownership, approvals, encumbrances or delivery history.
- 2. Protection deficit: deposits and instalments may be exposed before equivalent value is delivered.
- 3. Competence deficit: weak supervision, substandard materials and unapproved modifications undermine safety.
- 4. Recourse deficit: complaint, refund and dispute routes can be slow, unclear or costly.
- 5. Data deficit: fragmented transactions and valuations weaken pricing and lending confidence.
- 6. Relationship deficit: sales-centred engagement often gives way to silence after payment.
Formalisation signals: the LASRERA framework requires practitioner registration and provides for public registers, complaints and mediation. Federal land-digitisation plans aim to improve verification and increase formal transactions. These are necessary foundations, not proof that every registered actor or listed project is safe. Customers still need asset-level evidence and independent professional review.
The missing metric: no robust national series was found for “trust in real estate companies”. Industry leaders should commission a repeatable buyer/tenant trust index, segmented by journey stage, geography and actual transaction experience.
Research implication: do not invent a trust percentage to fill the evidence gap. Measure baseline confidence, willingness to recommend, comprehension of contracts, perceived fairness, proof usage and dispute resolution — and link results to conversion and retention.
Sources: Council for the Regulation of Engineering in Nigeria (2025); Federal Ministry of Housing and Urban Development (2024); G. Elias (2022).
Customer trust journey: trust is won or lost at six observable moments
Every stage needs an operational owner, a customer-facing proof and a measurable service standard.
| Journey stage | Customer question | Typical failure | Trust intervention | Evidence metric |
|---|---|---|---|---|
| Discover | “Is this offer real?” | Fake or outdated listing; hidden charges | Verified listing ID; all-in price; practitioner registration | Verified-listing rate |
| Evaluate | “Can I validate the asset?” | Documents withheld; render presented as fact | Open data room; independent inspection; sample contract | Data-room completion |
| Commit | “Is my money protected?” | Personal account; unclear refund or milestone terms | Client/escrow structure; milestone releases; receipt | Protected-payment share |
| Track | “Will it be delivered as promised?” | Progress silence; changing specifications | Time-stamped reports; variation log; inspection certificate | Update punctuality |
| Handover | “Did I receive what I bought?” | Incomplete documents; defects; unclear charges | Snag list; title/handover file; service-charge statement | First-time handover pass |
| Own / occupy | “Will someone respond?” | Unresolved defects; arbitrary charges; deposit disputes | SLA; audited charges; fair deposit and repair process | Resolution time; recovery satisfaction |
Design principle: move proof upstream. A buyer should encounter title, cost, delivery and remedy evidence before the emotional sales pitch — not after raising an objection.
Stakeholders and jobs-to-be-done: different actors buy different kinds of certainty
Segmentation must move beyond demographics to risk exposure, desired progress and the proof each actor needs.
Priority jobs-to-be-done:
| Actor | Job | Anxiety to remove |
|---|---|---|
| First-time buyer | “Help me secure a habitable asset without losing my savings.” | Title fraud, unaffordable payments, non-delivery |
| Tenant | “Help me find a real home with predictable costs and fair treatment.” | Fake listings, deposits, service-charge surprises |
| Diaspora investor | “Help me transact remotely with independent control.” | Reliance on relatives, false progress, weak recourse |
| Developer / owner | “Help me convert demand while protecting capital and reputation.” | Slow absorption, disputes, contractor failure |
| Lender / investor | “Help me verify cash flow, collateral and governance.” | Weak documentation, valuation uncertainty, exit risk |
Stakeholder accountability map:
| Stakeholder | Trust obligation |
|---|---|
| Developer / sponsor | Accurate claims, funding, delivery, remedies |
| Agent / platform | Identity, listing accuracy, fee disclosure |
| Lawyer / surveyor | Independent title, survey and contract verification |
| Engineer / contractor | Design compliance, materials, inspection and safety |
| Lender / payment partner | Protected flows, affordability, records |
| Regulator / registry | Accessible records, enforcement, dispute channels |
| Facility manager | Transparent charges, maintenance, response |
| Community / association | Local legitimacy, responsible engagement |
Shared-service opportunity: no single actor can solve the trust deficit alone. A neutral transaction and assurance layer can coordinate evidence while preserving each professional’s legal responsibility.
Section 02 — Market attractiveness
A 37-market, 21-indicator screen reveals where demand, economic depth, growth, infrastructure and operating conditions reinforce one another.
National MAI ranking: Lagos leads; the next tier is geographically and economically diverse
Ogun ranks second, followed by Rivers, Oyo and Anambra. The appropriate asset thesis differs across each.
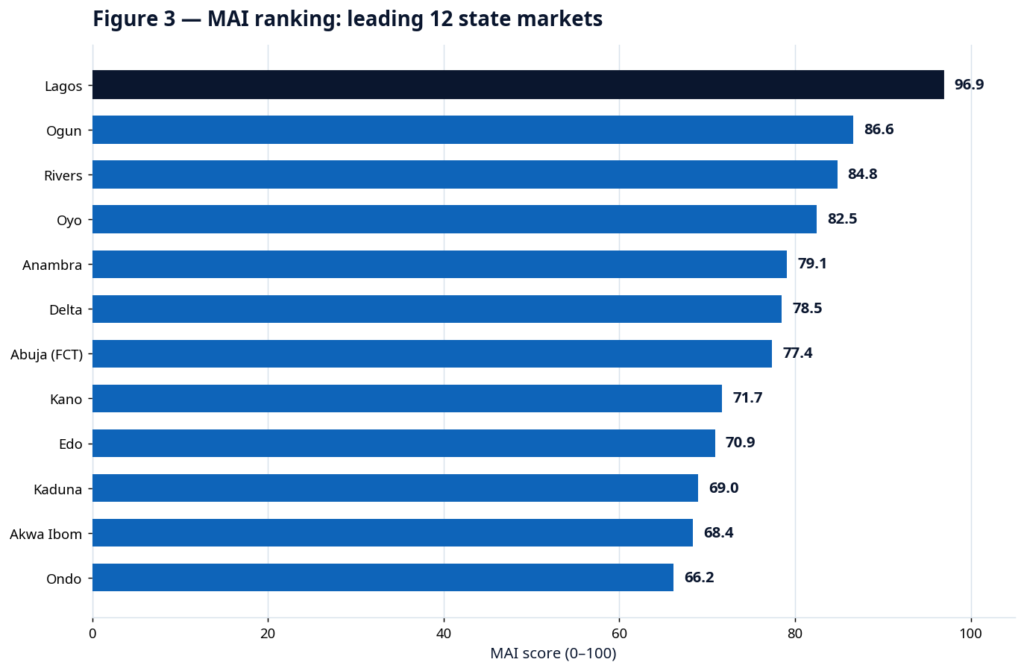
Source: Mediology analysis of supplied Master Dataset MAI 2026. All 37 markets are listed in Table 1 below.
Scale leader — Lagos · 96.9: exceptional economic depth and demand; still requires micro-market, title and affordability discipline.
Next tier — Ogun · Rivers · Oyo: different logics: Lagos spillover and industry; energy and services; large population and education nodes.
Selective expansion — Anambra · Delta · FCT: strong relative scores with distinct risk, demand and product considerations.
Opportunity–operating matrix: large demand pools do not always offer the easiest execution
The matrix identifies where deeper diligence is needed and where a focused niche may outperform a broad market entry.
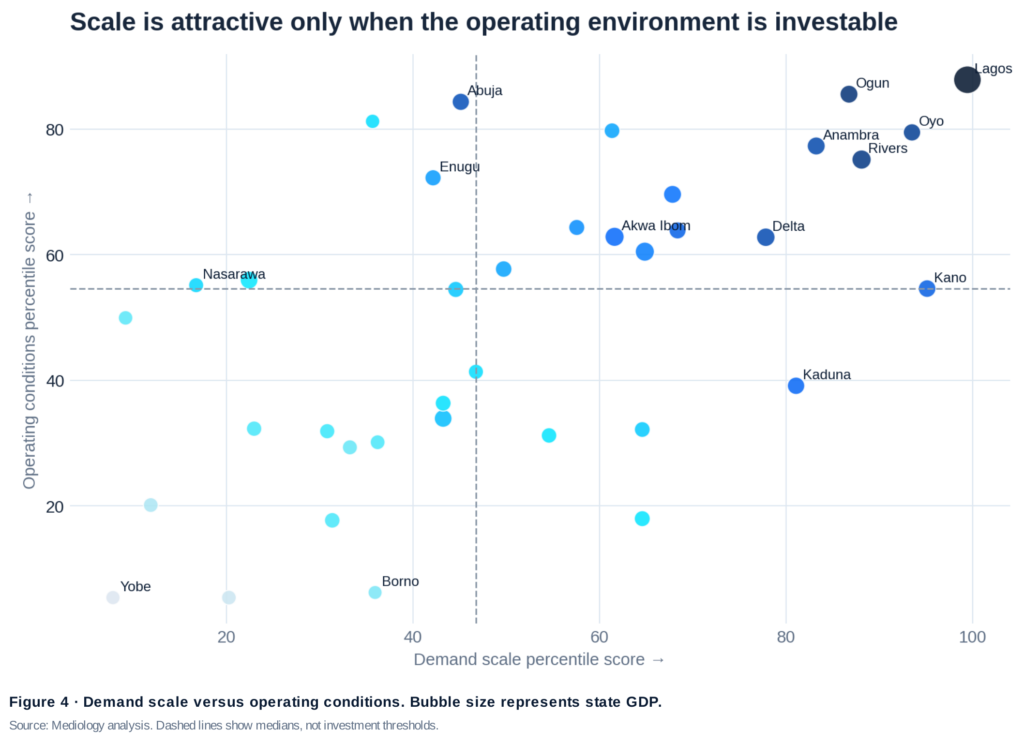
Source: Mediology analysis. Dashed lines show medians, not investment thresholds. Bubble size represents state GDP.
Upper right: prioritise, then localise. Lagos, Ogun, Rivers, Oyo, Anambra and the FCT combine relatively strong demand and operating scores. Micro-market selection remains decisive.
High scale, higher friction. Kano and Kaduna demonstrate why population or node strength cannot be read without security, income and operating context.
All 37 markets: a national screen with operating conditions visible alongside rank
The full table prevents a single composite score from hiding execution friction.
Table 1 — Full national screening output
| # | Market | MAI | Op. | # | Market | MAI | Op. |
|---|---|---|---|---|---|---|---|
| 01 | Lagos | 96.9 | 88 | 20 | Benue | 45.8 | 32 |
| 02 | Ogun | 86.6 | 86 | 21 | Nasarawa | 43.1 | 55 |
| 03 | Rivers | 84.8 | 75 | 22 | Ekiti | 41.6 | 81 |
| 04 | Oyo | 82.5 | 79 | 23 | Kogi | 41.3 | 41 |
| 05 | Anambra | 79.1 | 77 | 24 | Plateau | 40.5 | 36 |
| 06 | Delta | 78.5 | 63 | 25 | Bauchi | 39.9 | 31 |
| 07 | Abuja (FCT) | 77.4 | 84 | 26 | Katsina | 39.7 | 18 |
| 08 | Kano | 71.7 | 55 | 27 | Bayelsa | 38.7 | 56 |
| 09 | Edo | 70.9 | 64 | 28 | Adamawa | 32.5 | 32 |
| 10 | Kaduna | 69.0 | 39 | 29 | Sokoto | 30.4 | 18 |
| 11 | Akwa Ibom | 68.4 | 63 | 30 | Gombe | 30.2 | 32 |
| 12 | Ondo | 66.2 | 70 | 31 | Kebbi | 30.2 | 30 |
| 13 | Imo | 63.4 | 60 | 32 | Ebonyi | 27.9 | 50 |
| 14 | Abia | 59.9 | 64 | 33 | Jigawa | 26.4 | 29 |
| 15 | Enugu | 56.7 | 72 | 34 | Borno | 23.8 | 6 |
| 16 | Osun | 55.2 | 80 | 35 | Taraba | 16.9 | 20 |
| 17 | Kwara | 55.0 | 58 | 36 | Zamfara | 12.6 | 5 |
| 18 | Niger | 48.7 | 34 | 37 | Yobe | 10.2 | 5 |
| 19 | Cross River | 46.6 | 54 |
MAI: composite relative attractiveness score out of 100. Op.: operating-condition pillar percentile; higher is more favourable. Use: shortlist by state–segment fit; never acquire on rank alone.
Data: Master Dataset MAI 2026, supplied. Model and risk bands: Mediology analysis. Percentile scores are relative to this dataset.
Regional read-through: regional averages guide context; state–segment fit guides capital
The North West’s demand score exceeds its operating score; the South East shows the opposite pattern.
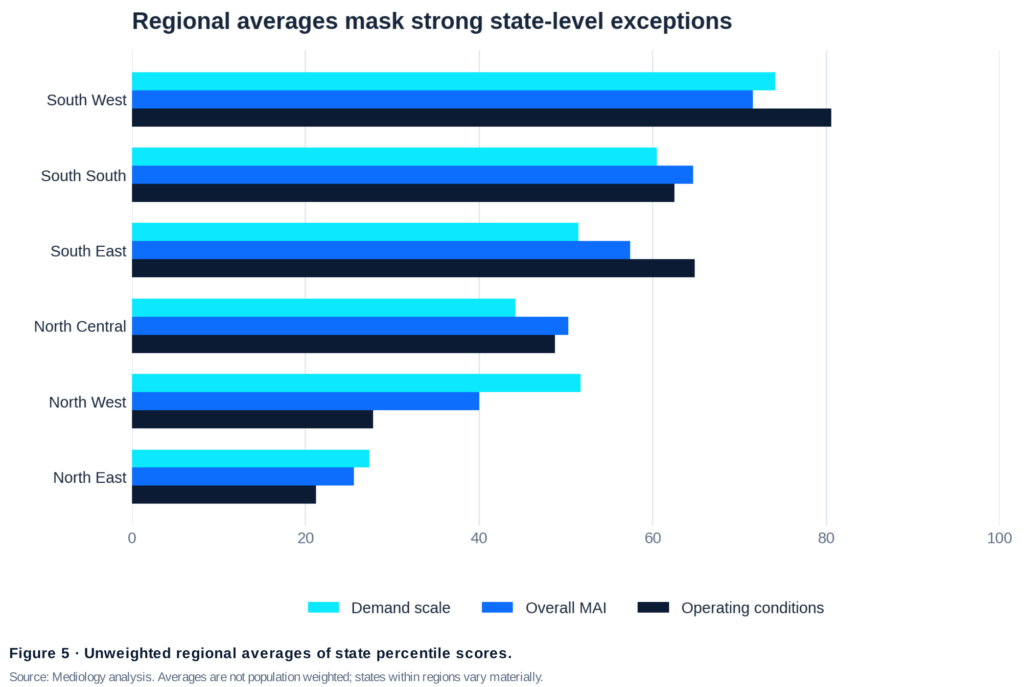
Source: Mediology analysis. Averages are not population weighted; states within regions vary materially.
South West: highest average MAI and operating score, driven by Lagos, Ogun and Oyo. Best suited to diversified residential, logistics, rental and trust-service theses — with intense competition.
South South & South East: strong economic or commercial nodes support selective residential, hospitality, retail and industrial strategies. Asset-level security and demand validation remain essential.
Northern markets: Kano and Kaduna show that a lower regional average does not eliminate opportunity. It raises the need for focused segments, local partnerships, security screening and conservative absorption assumptions.
Segment attractiveness: the “best market” changes with the asset question
Kano rises in logistics and retail; the FCT is strong in mid-market residential; digital trust infrastructure is strongest in large connected economies.
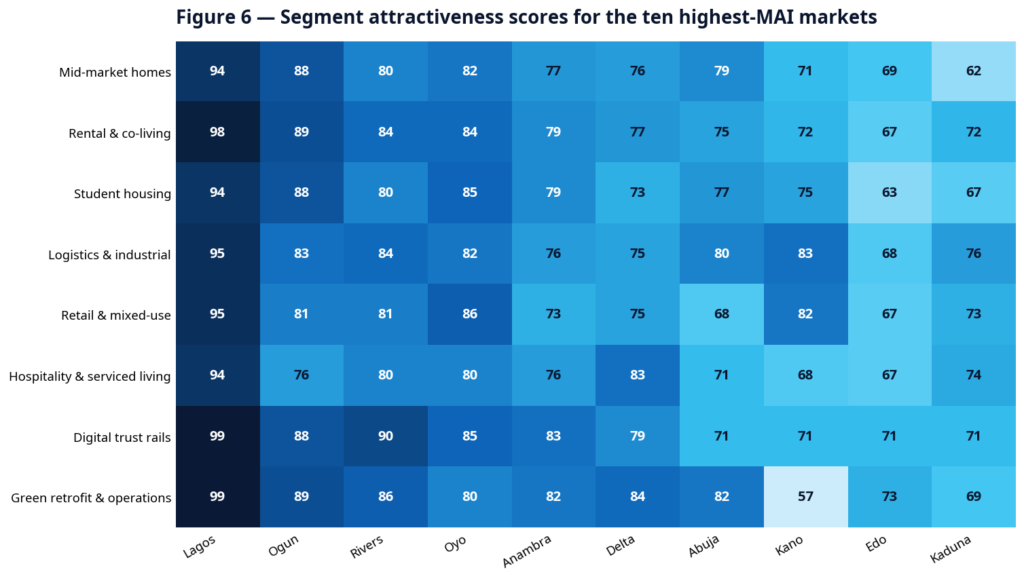
Source: Mediology analysis of supplied dataset. Segment indices use different indicator weightings; scores are relative screening outputs.
Logistics and industrial indices weight industrial density, trade, GDP and transport nodes. Student housing weights higher institutions and youth-relevant infrastructure. Digital trust weights internet, banking, population and economic activity. These are hypotheses for local validation — not measured asset-class returns.
Lead-market playbooks: standardise trust; localise the investment thesis
A repeatable operating system should travel further than a standardised property product.
| Market | MAI | Where the evidence points | Priority entry logic | Critical diligence |
|---|---|---|---|---|
| Lagos | 96.9 | Exceptional scale, GDP, infrastructure and connectivity | Transparent rental operations; compact mid-market; trust rails; selective logistics | Micro-market oversupply; title; flood; total occupancy cost |
| Ogun | 86.6 | Lagos spillover, growth, industry and strong operating score | Workforce housing; industrial/logistics; commuter-corridor services | Real employment/transport links; infrastructure delivery; commute absorption |
| Rivers | 84.8 | Economic depth, trade and industrial base | Industrial services; managed rental; selective mixed-use | Security; tenant covenant; environmental and location risk |
| Oyo | 82.5 | Large demand base, education and growing nodes | Student/workforce living; mid-market homes; neighbourhood retail | Income depth; corridor selection; supply pipeline |
| Anambra | 79.1 | Commercial activity and affluent-middle segment | Trade-linked logistics; compact housing; verified transactions | Security; title; formal tenant/income documentation |
| Abuja (FCT) | 77.4 | High growth, infrastructure and operating score; smaller scale | Professionally managed rental; diaspora-ready sales; selective serviced living | Product–price fit; premium absorption; infrastructure charges |
Portfolio rule: do not copy a Lagos product into every high-ranking state. Carry across the proof system; localise the asset, price, unit mix, channel and partner model.
Section 03 — Investment risk
A market can be attractive and an asset still be uninvestable. Risk must be priced, mitigated, assigned and monitored before the sales story begins.
Investment risk heat map: title, execution and affordability form the critical risk cluster
Risk is not a footnote to market attractiveness; it is the mechanism by which attractive markets destroy poorly structured capital.
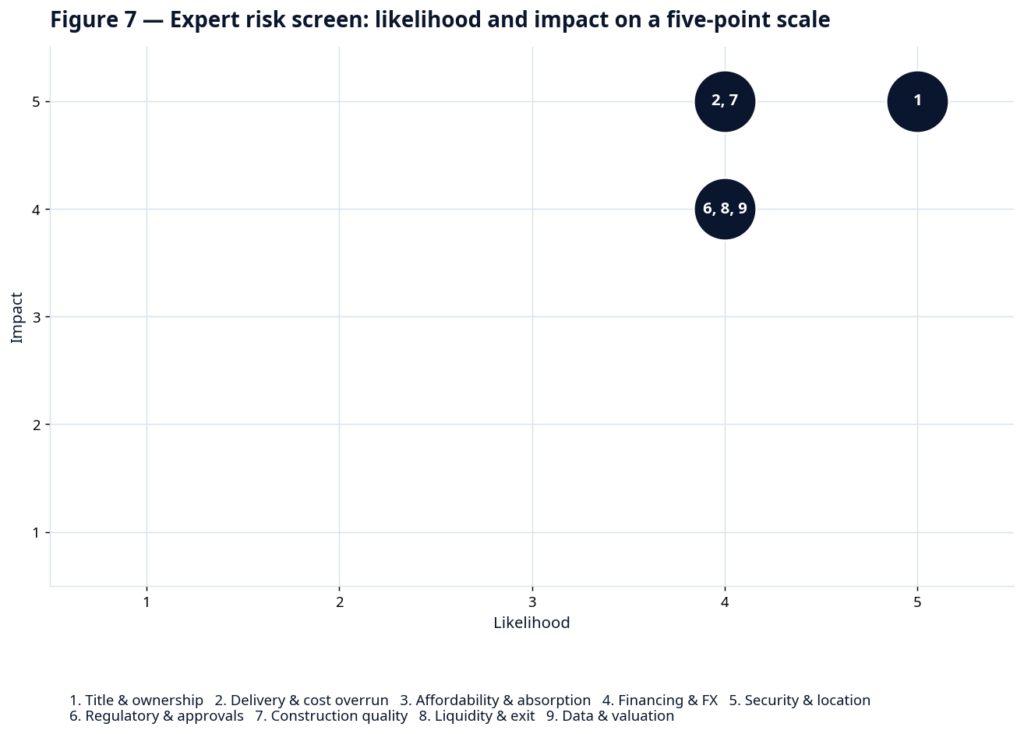
Source: Mediology expert assessment informed by the evidence reviewed. Ratings are qualitative and should be replaced with deal-specific risk ownership and exposure estimates.
Highest-priority cluster: title and ownership, delivery and cost overrun, affordability and absorption, financing and FX, and construction quality require board-level gates. Security, approvals, liquidity and data risks remain material by asset and location.
Scenario and sensitivity: combined shocks — not single variables — break fragile projects
A credible investment case needs a funded downside, not just an attractive base case.
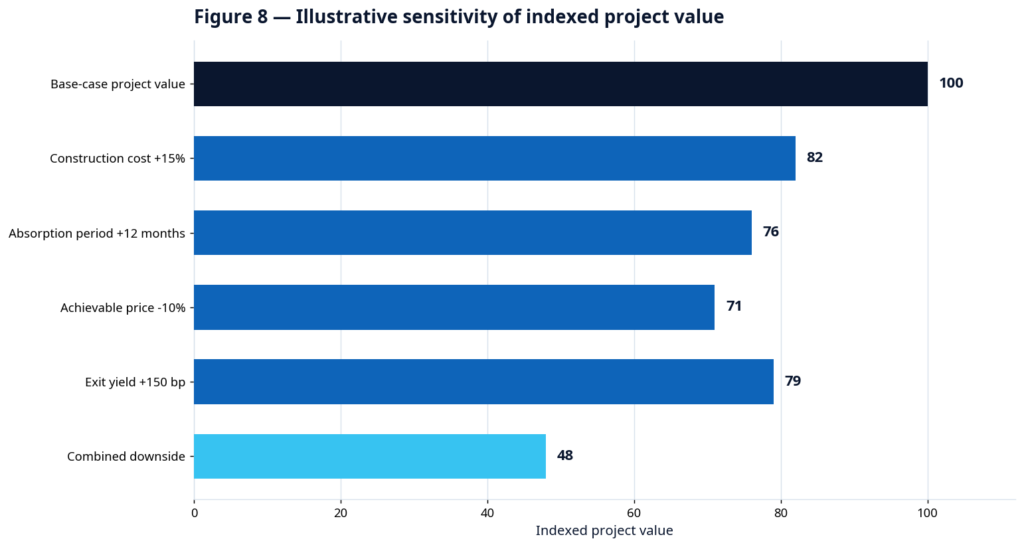
Source: Mediology illustrative scenario. This is a decision example, not a valuation, forecast or expected return.
| Shock | Primary value mechanism | Mitigation / investment gate |
|---|---|---|
| Construction cost +15% | Margin compression; funding gap; specification pressure | Contingency, procurement lock, value engineering, staged commitments |
| Absorption +12 months | Slower collections; higher interest and selling cost | Validated pre-sales, phased inventory, realistic velocity and cancellation assumptions |
| Price −10% | Lower revenue and deposit coverage | Conservative comparable evidence; affordability testing; exit price floor |
| Exit yield +150 bp | Lower terminal value; refinancing pressure | Longer hold option; durable tenant cash flow; no forced-exit dependence |
| Combined downside | Correlated losses overwhelm single-shock buffers | Minimum liquidity and coverage covenant; stop-loss and redesign trigger |
Board question: does the project remain solvent and deliverable in the combined case? If not, reduce leverage, phase the scheme or do not proceed.
Due-diligence stage gate: no evidence, no capital release
A disciplined gate system protects buyers, lenders and developers from irreversible commitments built on weak assumptions.
The five stages:
- 1. Screen — state–segment fit.
- 2. Verify — title · approvals · demand.
- 3. Structure — capital · contracts · protection.
- 4. Commit — phased capital release.
- 5. Monitor — proof · covenant · exit.
| Gate | Non-negotiable evidence | Stop / redesign trigger | Accountable owner |
|---|---|---|---|
| 1 · Market | Local absorption, competing pipeline, target incomes, price and rent comparables | Demand only at unrealistic price or incentives | Investment + research |
| 2 · Title & planning | Independent search, survey, ownership chain, encumbrances, consent and approvals | Unresolved ownership, acquisition or planning defect | Legal + surveying |
| 3 · Technical | Geotechnical, design, BoQ, drainage/climate screen, contractor record | Unsafe design, unfunded scope or unacceptable site condition | Engineering + cost |
| 4 · Commercial | Base/downside model, funding proof, tax, FX and exit routes | Combined case fails liquidity or delivery threshold | Finance + investment |
| 5 · Customer protection | Milestone account, plain contract, refund/variation terms, complaints route | Payment requested before corresponding protection exists | Legal + customer |
| 6 · Delivery & exit | Inspection calendar, reporting, handover file, operations and exit plan | No verified programme or accountable asset operator | PMO + operations |
Capital release principle: release capital against evidence and independently inspected milestones — not against sales momentum, seniority or optimistic reporting.
Section 04 — Market gaps and whitespace
The next wave of value creation will come from solving neglected transaction, affordability and operating problems — not simply adding more undifferentiated stock.
Market gaps: eight unresolved problems are hiding commercial opportunity
The strongest gaps reduce uncertainty, improve affordability or raise the performance of existing stock.
| Market gap | What is missing | Customer / investor cost | Commercial response |
|---|---|---|---|
| Trusted transaction infrastructure | Portable verification of identity, listing, title pack and transaction status | Search cost, fraud exposure, delayed closing | Verification subscription, transaction fee, professional network |
| Protected off-plan purchase | Milestone-linked money, independent inspection and enforceable remedies | Fear of non-delivery; weak conversion; disputes | Escrow coordination, assurance fee, developer SaaS |
| Transparent rental operations | Verified homes, clear fees, deposit logic and responsive maintenance | Time loss, arbitrary charges, poor tenant experience | Management fee, leasing fee, premium operations |
| Attainable formal housing | Efficient units near jobs with predictable total occupancy cost | Exclusion from formal supply; long commutes | Compact development, rent-to-own where legally/financially sound |
| Independent delivery assurance | Objective progress, quality and specification reporting | Information asymmetry between sponsor and buyer/lender | Inspection, certification and monitoring contracts |
| Neighbourhood logistics | Right-sized, professionally operated last-mile and SME spaces | Inventory friction and unreliable distribution | Logistics parks, shared warehousing, operating services |
| Existing-stock performance | Energy, water, maintenance and service-charge optimisation | High lifecycle cost and asset deterioration | Retrofit, facility analytics, performance contracts |
| Reliable market data | Comparable transactions, supply, absorption and neighbourhood risk | Mispricing and weak credit/investment decisions | Data products, valuation support, research subscriptions |
Gap selection test: prioritise gaps with frequent pain, a clear payer, a repeatable delivery model and a legally defensible role. A social problem becomes a business only when someone can and will pay for the solution.
Whitespace prioritisation: trust services combine strong need with relatively low capital intensity
Transparent rental management and independent assurance offer faster entry paths; compact housing and off-plan protection require deeper operational and regulatory capability.
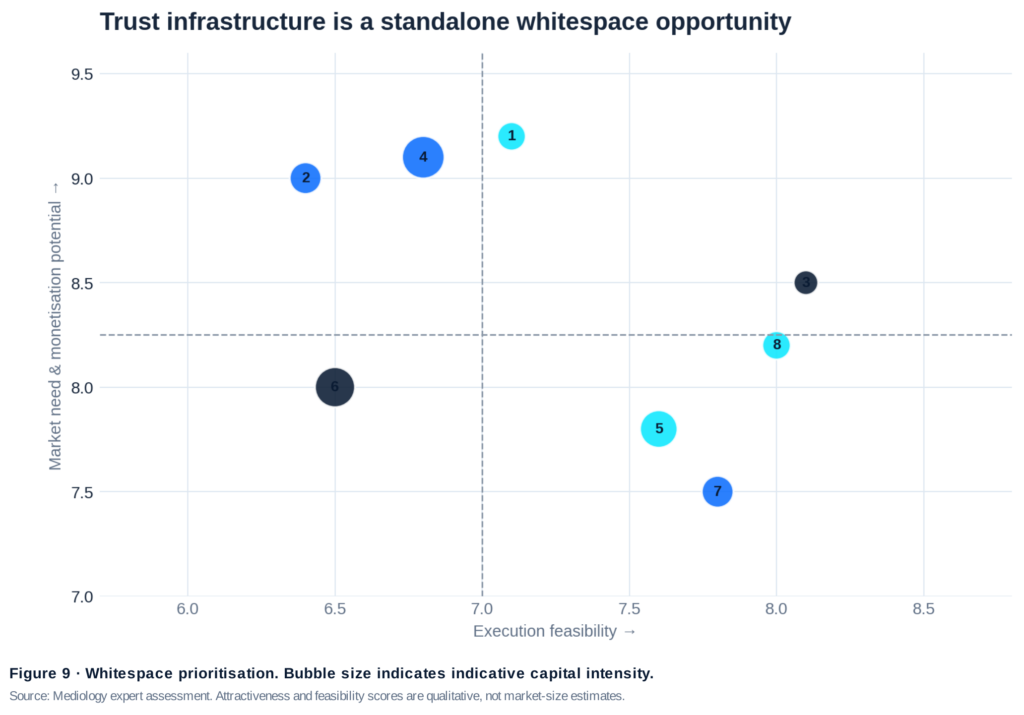
Source: Mediology expert assessment. Attractiveness and feasibility scores are qualitative, not market-size estimates. Bubble size indicates indicative capital intensity.
| # | Whitespace | Entry model |
|---|---|---|
| 1 | Verified title & transaction rail | Professional verification + workflow + records |
| 2 | Escrowed off-plan delivery | Milestone payment coordination + independent assurance |
| 3 | Transparent rental management | Verified leasing + deposits + responsive operations |
| 4 | Mid-market compact homes | Efficient units + total-cost discipline + phased delivery |
| 5 | Student & workforce living | Institution/employer-linked demand + managed operations |
| 6 | Neighbourhood logistics | SME/last-mile space + shared operating services |
| 7 | Energy-efficient retrofit | Audit + upgrades + performance monitoring |
| 8 | Independent asset assurance | Inspection + progress + handover + compliance evidence |
Category entry points for new players: enter through a narrow proof of value — not a broad property ambition
Asset-light entrants can build trust and cash flow before taking development risk; developers should phase inventory around verified demand.
| Entry point | First saleable offer | Revenue logic | Critical capability / licence question | Best launch posture |
|---|---|---|---|---|
| Verification & listings | Verified property/practitioner dossier with status and expiry | Verification fee, subscription, qualified transaction fee | Registry access, professional liability, data protection | One city; paid verification; no “guarantee” claim |
| Rental operations | Verified leasing plus transparent deposit and maintenance workflow | Leasing and management fees; tenant services | Agency registration, client money, deposit and dispute rules | Landlord cluster; measurable response SLA |
| Asset assurance | Independent milestone and handover inspection | Inspection and monitoring contracts | Engineering credentials, independence, professional indemnity | Lender/developer pilots; publish sample report |
| Compact residential | Small efficient units with all-in occupancy disclosure | Development margin and operations | Title, planning, funding, absorption and construction | Single phase; pre-validated buyer segment |
| Student/workforce living | Managed beds near verified demand anchors | Beds, leases and operations | Institution/employer demand, safeguarding, service standards | Anchor agreement before scale |
| Logistics / SME space | Right-sized units with power, access and shared services | Rent, service and operating income | Tenant covenants, truck access, power and security | Pre-let anchor; phased modular space |
| Green retrofit | Energy/water audit and high-payback upgrades | Audit, project and performance fees | Technical measurement, savings verification, financing | Start with existing managed portfolio |
| Market intelligence | Neighbourhood supply, price and absorption evidence | Research subscription and advisory | Data rights, method transparency, sampling quality | Publish one reliable local index |
Regulatory requirements vary by activity and state. Obtain Nigerian legal, tax, payments, securities and data-protection advice before launch.
Choices for existing investors: fix the portfolio before expanding the promise
Incumbents should scale high-fit strengths, repair weak capabilities and exit compounded risk.
Ansoff growth choices:
| Route | Move for incumbents | Guardrail |
|---|---|---|
| Market penetration | Improve conversion of current projects through proof packs, transparent pricing and referral from delivered customers | No media scale before complaint and delivery readiness |
| Product development | Add property management, assurance, retrofit or flexible living around existing customers | Build operating capability; avoid unrelated diversification |
| Market development | Take proven trust system into a second high-fit state | Localise product, partner and absorption assumptions |
| Diversification | Create independent data or transaction infrastructure | Separate governance and manage conflicts of interest |
Portfolio triage · GE/McKinsey logic (attractiveness × strength):
| Attractiveness × strength | Decision |
|---|---|
| High × strong | Scale with proof; protect delivery capacity and cash |
| High × weak | Partner, acquire capability or run a limited pilot |
| Low × strong | Harvest cash; improve operations; avoid new inventory |
| Low × weak | Exit, dispose or stop; do not subsidise hope |
Existing-investor priority: audit every project for title completeness, delivery exposure, real absorption, complaint burden and lifecycle performance. Capital should follow verified strength, not sunk-cost emotion.
VRIO: what can become a durable advantage?
| Asset | Valuable? | Rare? | Hard to imitate? | Organised to capture? | Verdict |
|---|---|---|---|---|---|
| Land inventory | Yes | Sometimes | No | Often | Temporary advantage |
| Delivered trust record | Yes | Yes | Yes, over time | Only if documented | Potential sustained advantage |
| Transaction + performance data | Yes | Yes, if proprietary | Yes, with history | Requires governance | Potential sustained advantage |
| Proof-led operations | Yes | Yes | Process + culture | Requires leadership | Strongest strategic platform |
Section 05 — Marketing communications and repositioning
Trust recovery begins in operations and becomes visible through consistent evidence, plain language, independent voices and measurable service recovery.
Repositioning strategy: move from “trust us” to “verify us”
The winning position is not a louder promise; it is a more checkable relationship.
Master positioning: For property customers who need certainty before commitment, [Brand] is the property partner that makes every promise verifiable — through open documentation, protected milestones, independent inspection and responsive ownership.
STP: choose who to serve
- Primary: risk-aware first-time and mid-market buyers; quality-seeking tenants; diaspora customers requiring remote verification.
- Secondary: lenders, investors, employers and institutions needing evidence-ready delivery and operations.
- Sacrifice: buyers seeking guaranteed speculative returns; products the organisation cannot deliver reliably.
Purpose: to make property decisions safer, clearer and more dependable.
Promise: every claim has evidence. Every payment has a purpose. Every issue has an owner.
Personality: precise · accountable · human.
Brand idea: PROOF YOU CAN LIVE WITH.
Reasons to believe: open title and cost packs; delivered-project record; protected milestones; independent inspections; dated progress; published service levels.
Do not say: “risk-free”, “guaranteed appreciation”, “100% trusted”, “title assured” or “on time” unless the claim is legally supportable, current and scoped.
The six-layer trust operating model: repositioning becomes credible when proof has an owner
Each layer converts a customer anxiety into an operating control and a publishable artefact.
| Layer | Control | Publishable artefact |
|---|---|---|
| 01 · Identity | Verify legal entities, practitioners, beneficial ownership and listing authority. | Registration · KYC · mandate · expiry |
| 02 · Asset | Assemble independent title, survey, planning, encumbrance and approvals records. | Data room · search · survey · approvals |
| 03 · Money | Separate client funds; link releases to defined value and documented milestones. | Account · receipts · release certificate |
| 04 · Delivery | Publish programme, actual progress, specifications, variations and independent inspections. | Dated report · photo · sign-off |
| 05 · Handover | Provide complete legal, technical, defects and operating documents; disclose total costs. | Handover index · snag · service statement |
| 06 · Recovery | Own complaints, delays, refunds and repairs through timed escalation and remedy. | Case ID · SLA · outcome · learning |
Governance: a Trust & Delivery Council should meet monthly: executive sponsor, legal, engineering, finance, sales, customer experience and independent assurance. Marketing attends; it does not own the evidence.
Public proof dashboard: show delivered versus promised milestones, inspection status, open defects, response time and resolved complaints. Include definitions, reporting period and exceptions.
Independence safeguard: verification and inspection providers need documented methods, conflicts disclosure and professional accountability. A badge created by the seller is not independent assurance.
Message architecture: one promise, six audience-specific proof paths
The brand remains consistent while the evidence and call to action change with the customer’s risk.
| Audience | Lead message | Proof to show | Primary CTA |
|---|---|---|---|
| First-time / mid-market buyer | Know what you are paying for — and what happens next. | All-in cost sheet, title pack, milestone plan, sample handover file | Download the buyer proof pack |
| Tenant | A real home. Clear fees. A response when you need it. | Verified listing, fee schedule, deposit rules, response SLA | Book a verified inspection |
| Diaspora customer | Buy remotely without surrendering independent control. | Live video inspection, independent report, protected payments, named case owner | Appoint your independent review |
| Investor / lender | Underwrite evidence, not optimism. | Absorption study, covenant pack, delivery record, inspection and downside model | Request the investment data room |
| Existing customer / advocate | We report the outcome — even when it is uncomfortable. | Status dashboard, resolution log, completed remedy | Track your case / project |
| Regulator / professional community | Formalisation works when evidence is accessible and accountability is shared. | Compliance register, methods, standards and resolution data | Review our governance standard |
Message hierarchy:
- 1. Outcome: confidence to commit.
- 2. Mechanism: verify, protect, prove, repair.
- 3. Evidence: current documents and third-party records.
- 4. Action: inspect, download, appoint or track.
Editorial tone: precise, calm and specific. Use short sentences. State limitations. Replace superlatives with dates, counts, named documents and accountable owners. Never conceal a delay behind lifestyle imagery.
Integrated PESO + experience communications: make every channel lead back to evidence
The campaign idea is an open file — not a new slogan. Paid, earned, shared, owned and service channels carry the same proof spine.
| Channel | Role in trust journey | Flagship execution | Measure |
|---|---|---|---|
| Paid | Create qualified demand around a specific asset and proof proposition | Search and social proof ads; geographically targeted OOH near actual corridors; no generic “trusted” claims | Qualified proof-pack downloads; cost per verified inspection |
| Earned | Independently test and legitimise the operating story | Media briefing with delivered evidence; regulator/professional dialogue; third-party site visits | Quality of coverage; correction rate; independent citations |
| Shared | Let customers inspect, question and compare | Live project clinics; progress reels with dates; Q&A document; customer community | Proof engagement; questions resolved; sentiment by issue |
| Owned | Serve as the authoritative evidence repository | Project data room, proof dashboard, buyer guides, contract explainers, service portal | Data-room completion; return visits; task success |
| Experiential | Make the asset and process physically checkable | Open-site days, independent inspection clinics, handover demonstrations | Inspection-to-commitment conversion; satisfaction |
| CRM / service | Sustain confidence after payment | Milestone alerts, variation notices, case ID, proactive delay and remedy communication | Update punctuality; resolution time; retention / referral |
Campaign platform · “Open File”: hook — “Before you pay, open the file.” Each execution exposes one document, one inspection or one resolved issue. OOH carries a project verification code; digital opens the live data room; sales uses the same evidence index; service closes the loop.
Media investment should follow proof readiness and sales capacity. Pause conversion advertising when inventory, documentation or response service cannot support demand.
Service recovery and measurement: trust is proven most clearly when something goes wrong
Recovery quality and delivery evidence must connect to commercial outcomes — not sit in separate brand and operations dashboards.
Service recovery protocol: Listen (case ID + facts) → Own (named lead + deadline) → Repair (remedy + confirmation) → Learn (root cause + control).
Service standard:
| Standard | Threshold |
|---|---|
| Acknowledge complaint | Same business day |
| Assign owner and next update | Within 1 business day |
| Provide substantive resolution plan | Within 5 business days |
| Publish delay and remedy notice | Before customer has to chase |
| Close defects | By severity-specific SLA |
| Audit service charge | Annually; accessible statement |
Trust-to-value KPI tree:
| Level | Metrics |
|---|---|
| Trust outcome | Verified trust score, confidence to transact, willingness to recommend |
| Proof usage | Data-room opens, document completion, independent inspection rate |
| Demand | Qualified inspections, conversion, cancellation, referral share |
| Delivery | Milestone reliability, variation rate, first-time handover pass |
| Experience | Response and resolution time, reopen rate, recovery satisfaction |
| Economics | CAC, sales velocity, price realisation, arrears, cost of rework |
| Governance | Evidence freshness, claims exceptions, audit closure, reporting timeliness |
Measurement rule: set baselines before targets. Every metric needs a definition, source, owner and action threshold. Report uncomfortable exceptions alongside favourable averages.
Implementation roadmap: pilot the proof system, then scale the story
The first 90 days build operating evidence; the next nine months convert it into repeatable market advantage.
| Horizon | Operating actions | Communications actions | Decision gate |
|---|---|---|---|
| 0–30 days · Diagnose | Audit title packs, claims, delivery, complaints and service charges; appoint executive owner | Freeze unsupported claims; map proof gaps; listen to recent buyers/tenants | Evidence and risk baseline signed off |
| 31–90 days · Build | Create six-layer controls, data room, contracts, case system and inspection calendar | Develop proof pack, Open File platform, training and pilot dashboard | Pilot project meets evidence standard |
| 3–6 months · Prove | Run one project and one rental portfolio; close defects; test milestone reporting | Launch proof-led pilot; host site clinics; publish first performance note | Conversion, delivery and resolution gates met |
| 6–12 months · Scale | Extend to next project/state; integrate partners; independent review | Scale PESO around verified outcomes; publish annual trust and delivery report | Capital release follows performance, not campaign reach |
Accountability:
- Board: risk appetite and capital gates.
- Executive sponsor: trust and delivery outcome.
- Legal/technical/finance: evidence integrity.
- Marketing: evidence accessibility and demand.
- Customer experience: resolution and learning.
12-month deliverables: verified asset and practitioner register; protected milestone-payment standard; independent inspection and handover protocol; public trust and delivery dashboard; repeatable market-entry and complaints playbook.
Scale gate: do not expand into a new market until the pilot proves documentation completeness, milestone reliability, complaint resolution and qualified absorption simultaneously.
Findings and recommendations: the strongest strategy is to make confidence investable
Focus capital on verified demand, build trust into the operating model, and let communications expose the evidence.
Findings:
- 1. Structural need remains compelling. Real estate contributed 12.71% of real GDP in Q2 2026; the official deficit estimate is 14.925 million units.
- 2. Affordability is the conversion bottleneck. Lower inflation and MPR improve conditions from a high base; they do not create household purchasing power.
- 3. Trust is a transaction and delivery problem. Land opacity, payment exposure, construction quality and recourse shape risk before brand perception.
- 4. Opportunity is concentrated but diverse. Lagos leads; Ogun, Rivers, Oyo and Anambra follow. Segment leadership varies by market.
- 5. Trust services are investable categories. Verification, rental operations and independent assurance can create value with lower capital intensity than development.
- 6. Incumbents must reform before repositioning. Evidence must be current, independent where necessary and connected to remedies.
Recommendations:
- 1. Select two state–segment theses. Validate local absorption and asset economics before further land or media commitments.
- 2. Adopt the six-layer trust model. Identity, asset, money, delivery, handover and recovery controls should become standard operating practice.
- 3. Launch one Open File pilot. Publish a complete proof pack, project dashboard and complaint standard for a live asset.
- 4. Build or partner for independent assurance. Separate verification from sales incentives and disclose methods and conflicts.
- 5. Develop recurring-revenue services. Prioritise transparent rental management, retrofit and assurance where capability fits.
- 6. Commission a national trust baseline. Measure confidence and actual journey outcomes; repeat annually and link to conversion and retention.
The board-level recommendation: treat trust as a governed asset with owners, controls, evidence and investment. The organisations that make property verifiable will be best placed to convert Nigeria’s structural demand into durable value.
About the author
Jim · Managing Consultant, Mediology Nigeria. A strategy-led perspective on market attractiveness, investment discipline and trust-centred brand transformation. Strategy and marketing communications advisor focused on turning market evidence into brand, investment and growth decisions. For this edition, Jim’s editorial lens connects two questions that are too often separated: where is the opportunity? and what must become true for customers and capital to trust it?
About Mediology Nigeria: Mediology Nigeria is a marketing communications consultancy working across strategy, brand management, market intelligence and integrated communications. The firm’s approach joins rigorous diagnosis, clear strategic choices and brand systems designed for measurable action.
Editorial approach: evidence before opinion · one reader task per page · proof before promotion · clear assumptions and limitations.
About this journal: The Trust Premium is a Mediology sector intelligence journal examining how markets create value when confidence is scarce. Evidence cut-off: 24 October 2026. Market statistics carry the reference period of their original indicators plus derived source. Later developments should be incorporated before capital is committed. Dataset: Master Dataset MAI 2026, supplied for this analysis: 36 states and the FCT, 46 indicators plus derived measures. This publication provides strategic market analysis, not legal, tax, valuation or investment advice. Scores are screening tools, not forecasts or guarantees. Every transaction requires independent title, technical, financial, regulatory and tax due diligence.
Start a conversation: Mediology Nigeria, 1 Montgomery Road, Yaba, Lagos, Nigeria · info@mediologyng.com
References
- AllAfrica. (2026, September 28). Nigeria: How real estate contributed 12.7 percent to GDP in Q2 2026. https://allafrica.com/stories/202609290401.html
- Central Bank of Nigeria. (2026, September 22). Key decisions of the Central Bank of Nigeria Monetary Policy Committee, September 21–22, 2026. https://www.cbn.gov.ng/MonetaryPolicy/decisions.html
- Council for the Regulation of Engineering in Nigeria. (2025). Building collapse record. https://coren.gov.ng/building-collapse-record/
- Federal Ministry of Housing and Urban Development. (2024, November 13). FG partners World Bank to develop National Land Digital System. https://www.fmhud.gov.ng/read/3387
- Federal Ministry of Information and National Orientation. (2026, January 26). FG’s Technical Committee releases new housing data, pegs deficit at 15 million units. https://fmino.gov.ng/fgs-technical-committee-releases-new-housing-data-pegs-deficit-at-15-million-units/
- Federal Republic of Nigeria. (1978). Land Use Act, Cap L5, Laws of the Federation of Nigeria 2004.
- Federal Republic of Nigeria. (2018). Federal Competition and Consumer Protection Act, 2018. Federal Competition and Consumer Protection Commission. https://fccpc.gov.ng/wp-content/uploads/2022/07/FCCPA-2018.pdf
- Federal Republic of Nigeria. (2023). Nigeria Data Protection Act, 2023.
- G. Elias. (2022). A review of the Lagos State Real Estate Regulatory Authority Law, 2021. https://www.gelias.com/images/Newsletter/A_Review_of_the_Lagos_State_Real_Estate_Regulatory_Law_2021_Apr_2022.pdf
- GWI. (n.d.). From awareness to action. https://www.gwi.com/reports/awareness-to-action
- Mayer, R. C., Davis, J. H., & Schoorman, F. D. (1995). An integrative model of organizational trust. Academy of Management Review, 20(3), 709–734. https://doi.org/10.2307/258792
- National Bureau of Statistics. (2026a). Nigerian gross domestic product report: Q2 2026. https://microdata.nigerianstat.gov.ng/index.php/catalog/147
- National Bureau of Statistics. (2026b). Consumer price index and inflation: September 2026. https://microdata.nigerianstat.gov.ng/index.php/catalog/154
- PwC Nigeria. (2026). Nigeria economic outlook: H2 2026. https://www.strategyand.pwc.com/a1/en/insights/nigeria-economic-outlook.html
- United Nations, Department of Economic and Social Affairs, Population Division. (2025). World urbanization prospects 2025: Summary of results. https://population.un.org/wup/assets/Publications/undesa_pd_2025_wup2025_summary_of_results_final.pdf
Supplied dataset: Mediology Nigeria. (2026). Master dataset MAI 2026 [Unpublished dataset supplied for this analysis].
Editorial image sources: Adobe Stock — Lagos, Nigeria skyline; Abuja, Nigeria (stock image search previews). African Land — Building homes with authenticity: Exploring the unique challenges and advantages of constructing domestic buildings in Nigeria.
Analytical notes: MAI and segment scores: Mediology calculations from the supplied dataset using percentile ranks and disclosed weights. Risk and whitespace scores: qualitative expert judgements. Scenario: illustrative index, not a forecast. Trust framework: property application of Mayer et al. (1995). Data cut-off: 24 October 2026.
See our Services page for the six integrated disciplines behind this approach.
Frequently asked questions
What is the Trust Premium in Nigeria real estate?
The Trust Premium is the advantage a developer earns when it reduces information asymmetry and protects the buyer’s downside — verifying title, identity and approvals; protecting payments through milestones; proving quality, progress and delivery; and repairing complaints, delays and recovery. It lowers sales friction, improves financing readiness and differentiates without relying on discounting.
How big is Nigeria’s housing deficit, and does it mean guaranteed demand?
The official estimate is 14.925 million housing units (2025). It is a measure of social and physical need based on persons per room and housing adequacy — not an order book for commercially priced units. Effective demand depends on income, financing, location, tenure preference, total occupancy cost and trust.
Which state markets are most attractive for real estate investment in 2026?
On Mediology’s 100-point Market Attractiveness Index (MAI), Lagos leads at 96.9, followed by Ogun (86.6), Rivers (84.8), Oyo (82.5) and Anambra (79.1), with Delta (78.5) and Abuja (FCT) (77.4) close behind. The appropriate asset thesis differs across each market, and the MAI is a screening tool — never acquire on rank alone.
What are the biggest investment risks in Nigeria real estate?
The highest-priority risk cluster is title and ownership, delivery and cost overrun, affordability and absorption, financing and FX, and construction quality. Combined shocks — not single variables — break fragile projects, which is why the journal recommends a six-gate due-diligence system where no evidence means no capital release.
What is the six-layer trust operating model?
It is the operating system that makes repositioning credible: identity (verify entities and practitioners), asset (independent title, survey and approvals), money (separate client funds, milestone-linked releases), delivery (published programme and independent inspections), handover (complete documents and disclosed total costs) and recovery (owned complaints with timed escalation and remedy). Each layer converts a customer anxiety into an operating control and a publishable artefact.