
Strategic Marketing Intelligence — Analysis Series. Prepared by Jim Ikpehai, Mediology Nigeria. Published March 2026.
Nigeria’s hot beverage market reaches 254.5 million consumers across three categories — cocoa, tea and coffee — drawn from a national population of 222.6 million. Cocoa owns the cup: 116.9 million consumers at 52.5% penetration, the largest category opportunity, with universal family appeal and mass-market reach. Tea holds strong at 92.6 million consumers (41.6%), consistent across regions and culturally anchored in the North. Coffee is the growth lane: 45.0 million consumers (20.2%), concentrated in urban, economically advanced states, with premium upside.
This report — the Hot Beverage Drinks Market Analysis — is a comprehensive state and regional evaluation of Coffee, Tea and Cocoa Beverages: market prioritization, Category Development Index metrics and strategic directions across Nigeria’s 36 states and the FCT. It is built to guide where to play first, how much to invest, and what to say in each market.
The headline finding: Lagos scores 100 on market attractiveness — and no other state clears 60. The South West is the most attractive region (MAI 44.5), with Lagos, Ogun and Oyo Priority 1 across all categories. The North West offers volume through Kano and Kaduna despite lower per-capita metrics, and the South East — below 90 on the development index in every category — is the clearest long-term growth frontier.
At a glance:
- 254.5M — total hot beverage consumers across the three categories
- 116.9M — cocoa consumers (52.5% penetration), the market leader
- 92.6M — tea consumers (41.6%), culturally anchored in the North
- 45.0M — coffee consumers (20.2%), the premium growth lane
- 100 — Lagos Market Attractiveness Index score; no other state clears 60
- 44.5 — South West MAI, the most attractive regional market
1. Executive summary
Cocoa owns the cup; coffee owns the upside.
This Nigeria hot beverage market analysis examines the hot beverage landscape across Nigeria’s 36 states and the Federal Capital Territory, combining macro-economic indicators into a market prioritization framework, Category Development Index (CDI) metrics, and strategic directions for the Coffee, Tea and Cocoa Beverage categories.
| Headline | Value | What it means |
|---|---|---|
| Total hot beverage consumers | 254.5M | Across the three categories |
| Total national population | 222.6M | The full addressable base |
| South West MAI | 44.5 | The most attractive regional market |
Cocoa dominates — 116.9M consumers (52.5%), the largest category opportunity, with universal family appeal and mass-market reach.
Tea holds strong — 92.6M consumers (41.6%), consistent across regions, culturally anchored in the North.
Coffee is the growth lane — 45.0M consumers (20.2%), concentrated in urban, economically advanced states; premium upside.
Where to play first: The South West leads market attractiveness — Lagos, Ogun and Oyo are Priority 1 across all categories. The North West offers volume through Kano and Kaduna despite lower per-capita metrics.
Priority 1 — Invest & Grow: Coffee: Lagos, Ogun, Oyo, Delta · Tea: Lagos, Oyo, Kano, Delta · Cocoa: Ogun, Oyo, Delta. These markets pair high attractiveness (MAI ≥ 40) with above-average category development (CDI ≥ 100) — warranting aggressive investment in distribution, marketing and product innovation.
2. Nigeria hot beverage market overview — size & penetration
One in two Nigerians drinks cocoa; one in five drinks coffee.
With over 222 million potential consumers across three categories, the Nigerian hot beverage market shows distinct regional preferences shaped by economic, cultural and demographic factors.
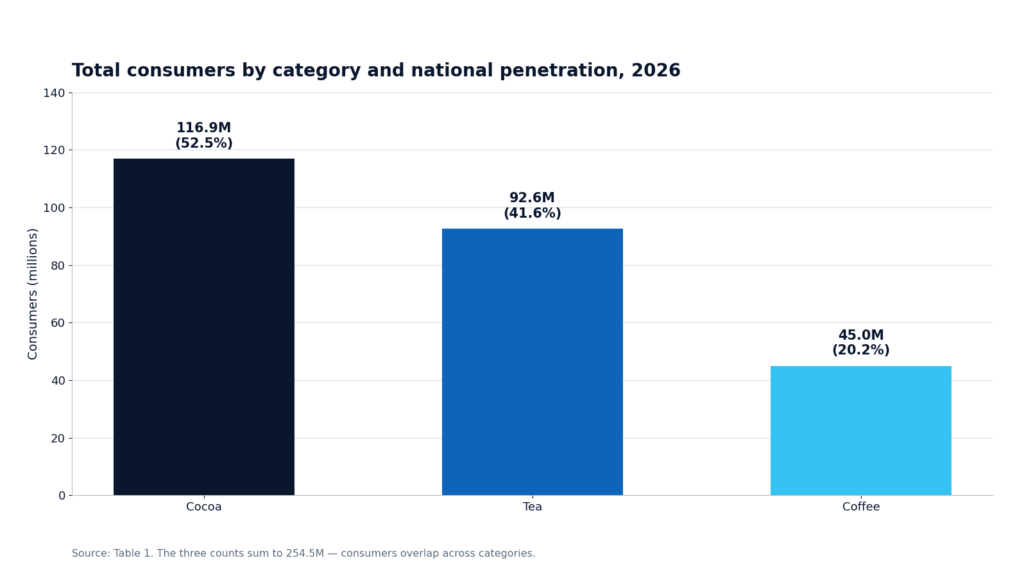
| Category | Total consumers | National penetration | Market position |
|---|---|---|---|
| Cocoa Beverages | 116,950,172 | 52.5% | Market leader |
| Tea | 92,570,719 | 41.6% | Strong challenger |
| Coffee | 45,037,450 | 20.2% | Niche / growing |
Reading the map: Penetration varies sharply by region: the South West leads coffee (24.8%) and cocoa (55.0%) on the back of Lagos’s economic weight, the North East leads tea (45.3%) on cultural preference — and the South East trails on all three, marking it as the growth frontier.
The North West pours the most cups; the South West pours the most value
Nigeria’s six geopolitical regions present distinct market characteristics driven by population distribution, economic development and infrastructure — the foundation for prioritization and resource allocation.
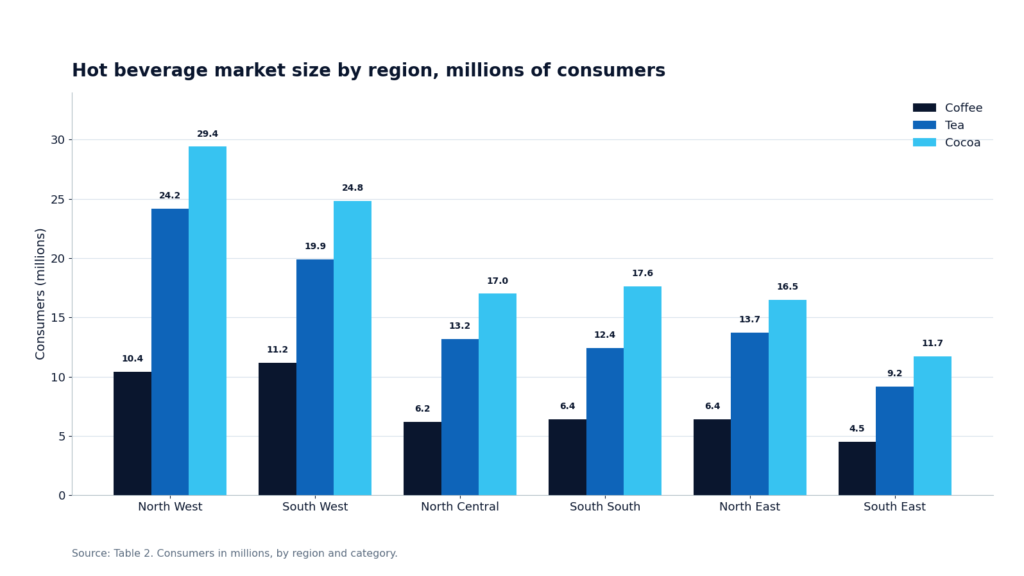
| Region | Population | Coffee (M) | Tea (M) | Cocoa (M) | MAI score |
|---|---|---|---|---|---|
| North West | 56,300,000 | 10.4 | 24.2 | 29.4 | 16.5 |
| South West | 45,000,000 | 11.2 | 19.9 | 24.8 | 44.5 |
| North Central | 33,300,000 | 6.2 | 13.2 | 17.0 | 23.6 |
| South South | 32,900,000 | 6.4 | 12.4 | 17.6 | 34.3 |
| North East | 30,200,000 | 6.4 | 13.7 | 16.5 | 8.4 |
| South East | 24,900,000 | 4.5 | 9.2 | 11.7 | 28.8 |
3. Regional analysis — size, share of throat & CDI
Cocoa takes nearly half the throat in every region.
Share of throat reveals the competitive structure inside each region: cocoa leads everywhere, tea holds a stable second, and coffee’s share rises meaningfully only in the South West.
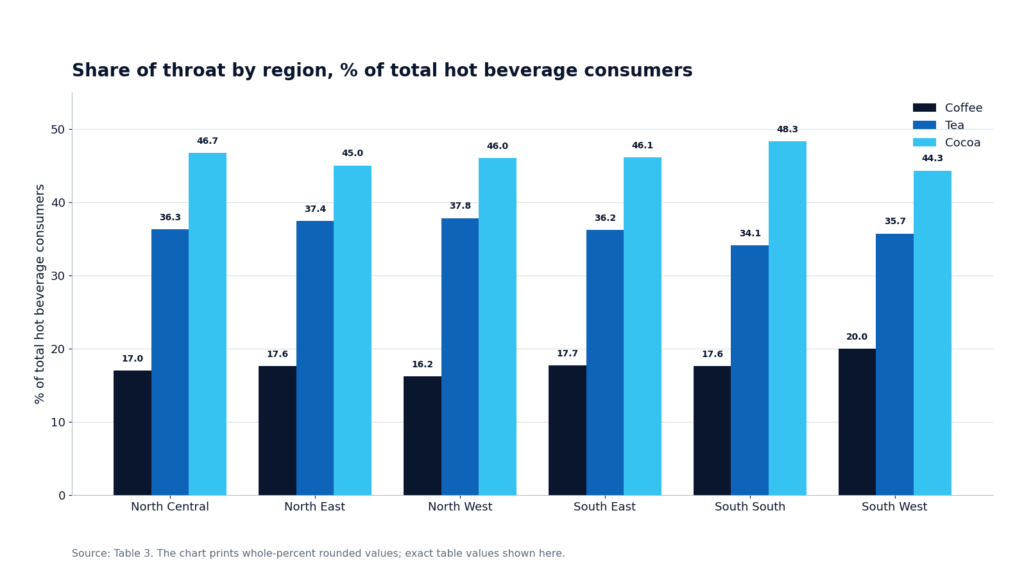
| Region | Coffee SoT | Tea SoT | Cocoa SoT | Key insight |
|---|---|---|---|---|
| North Central | 17.0% | 36.3% | 46.7% | Balanced portfolio opportunity |
| North East | 17.6% | 37.4% | 45.0% | Tea-strong region |
| North West | 16.2% | 37.8% | 46.0% | Volume-focused market |
| South East | 17.7% | 36.2% | 46.1% | Undeveloped potential |
| South South | 17.6% | 34.1% | 48.3% | Cocoa-dominant market |
| South West | 20.0% | 35.7% | 44.3% | Coffee opportunity market |
The development index maps exactly where each category is won
The Category Development Index measures penetration relative to the national average (CDI = 100). Above 100 signals developed demand; below 100 signals headroom.
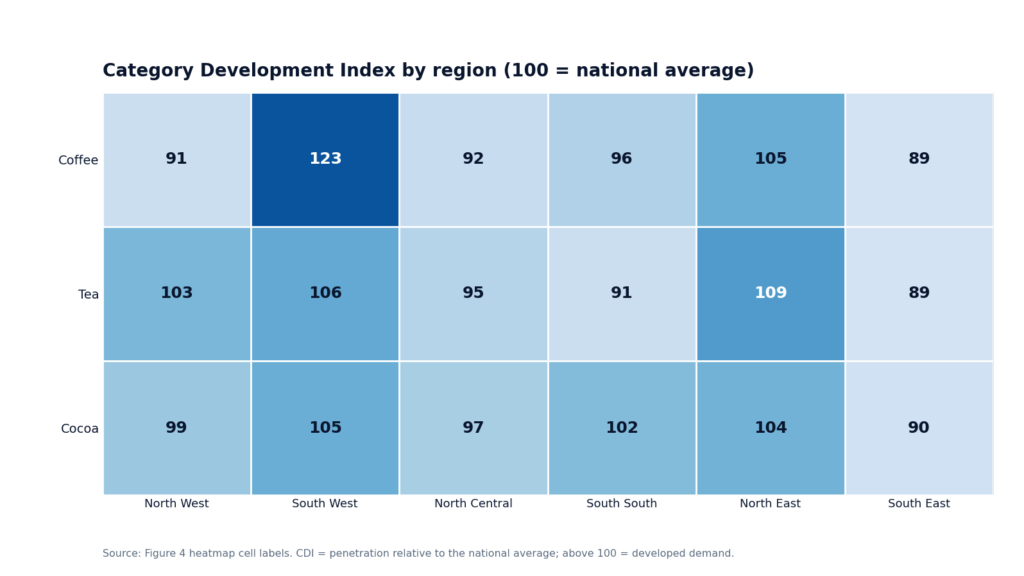
South West — developed: Above-average CDI on all three categories (123 coffee · 106 tea · 105 cocoa): mature demand, ready for premiumization.
North East — tea heartland: Tea CDI of 109, the strongest in the North, reflecting deep cultural affinity for the category.
South South — cocoa edge: Highest cocoa share of throat at 48.3%, with Delta leading the region’s development.
South East — open field: Below 90 on every category — undeveloped across the board, the clearest long-term growth opportunity.
4. Market prioritization matrix
Lagos scores 100 — no other state clears 60.
The Market Attractiveness Index combines six macro-economic indicators: middle-class population (25%), GDP per capita (20%), internet penetration (15%), banking access (15%), population size (15%) and real GDP growth (10%).
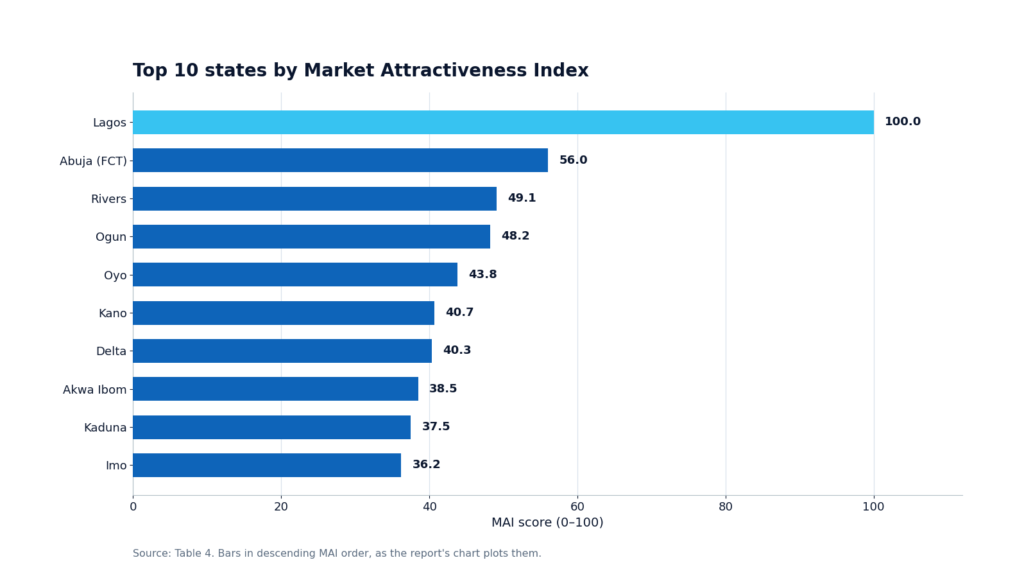
| Rank | State | Region | MAI score | Middle class | GDP / capita (₦) |
|---|---|---|---|---|---|
| 1 | Lagos | South West | 100.0 | 7.9M | 3,684,940 |
| 2 | Abuja (FCT) | North Central | 56.0 | 2.2M | 2,518,812 |
| 3 | Rivers | South South | 49.1 | 3.5M | 1,045,992 |
| 4 | Ogun | South West | 48.2 | 3.0M | 740,795 |
| 5 | Oyo | South West | 43.8 | 3.2M | 465,234 |
| 6 | Delta | South South | 40.3 | 2.6M | 987,558 |
| 7 | Kano | North West | 40.7 | 4.2M | 245,471 |
| 8 | Akwa Ibom | South South | 38.5 | 2.3M | 1,277,961 |
| 9 | Kaduna | North West | 37.5 | 2.7M | 492,009 |
| 10 | Imo | South East | 36.2 | 2.5M | 1,201,878 |
MAI × CDI turns 37 markets into four clear plays
The priority classification pairs market attractiveness with category development to create actionable segments for each category.
Priority 1 · Invest & Grow — MAI ≥ 40 + CDI ≥ 100. Maximum investment — innovation hubs and brand-building platforms.
Priority 2 · Build & Develop — MAI ≥ 30 + CDI ≥ 90. Targeted investment to accelerate category development.
Priority 3 · Maintain & Optimize — MAI ≥ 20 + CDI ≥ 80. Efficient coverage; optimize the existing footprint.
Priority 4 · Monitor & Evaluate — All other markets. Watch development indicators; re-enter as conditions improve.
| Category | Priority 1 | Priority 2 | Priority 3 | Priority 4 |
|---|---|---|---|---|
| Coffee | 4 states | 3 states | 6 states | 24 states |
| Tea | 4 states | 4 states | 8 states | 21 states |
| Cocoa | 3 states | 6 states | 7 states | 21 states |
What the spread means: Only 3–4 states per category earn full investment — focus is the strategy. The broad Priority 4 tail (21–24 states) confirms that hot beverage growth in Nigeria is a targeted game, not a blanket one.
5. Category deep dive — coffee, tea, cocoa
Coffee — premium, urban, young
Coffee follows the money: premium, urban, young.
45 million consumers and 20.2% penetration make coffee the premium growth play. Consumption tracks economic indicators — highest where GDP per capita and middle-class populations are elevated.
Urban concentration — Consumption clusters in Lagos, Abuja and major South West cities.
Income correlation — r = 0.72 between GDP per capita and coffee penetration.
Youth appeal — Higher-internet states show elevated coffee CDI — a digital-first audience.
Premium positioning — Banking access (r = 0.65) tracks category development — café culture and premium SKUs.
| State | Region | Consumers | CDI | MAI | Strategic focus |
|---|---|---|---|---|---|
| Lagos | South West | 4,129,651 | 123.7 | 100.0 | Premium positioning, innovation hub |
| Ogun | South West | 1,495,926 | 117.4 | 48.2 | Distribution expansion, trade hub |
| Oyo | South West | 1,642,636 | 100.2 | 43.8 | Urban penetration, Ibadan focus |
| Delta | South South | 1,459,299 | 116.3 | 40.3 | Warri market development |
Coffee play: Win the professional class where it lives and works: premium SKUs and café partnerships in Lagos, distribution muscle in Ogun and Oyo, and a South South anchor in Delta’s Warri market.
Tea — the steady hand
Tea is the steady hand: cultural in the North, wellness in the South.
Nigeria’s second-largest category with 92.6 million consumers at 41.6% penetration. Tea’s footprint is more uniform than coffee’s — strong across regions and demographic segments.
Cultural integration — Deep presence across Northern regions — traditional consumption occasions.
Health positioning — Growing appeal among health-conscious middle-class consumers; green and herbal variants.
Value focus — Price-sensitive category — efficient supply chain is the margin engine.
Functional benefits — Energy and wellness positioning resonates across segments.
| State | Region | Consumers | CDI | MAI | Strategic focus |
|---|---|---|---|---|---|
| Lagos | South West | 7,418,258 | 108.1 | 100.0 | Premium variants, modern trade |
| Oyo | South West | 3,845,442 | 114.2 | 43.8 | Traditional market strength |
| Kano | North West | 6,823,048 | 101.9 | 40.7 | Northern hub, volume focus |
| Delta | South South | 2,696,739 | 104.6 | 40.3 | South South expansion |
Tea play: Run a two-speed strategy: premium and specialty through Lagos modern trade; volume and value packs through Kano’s northern hub and Oyo’s traditional markets.
Cocoa beverages — the family default
Cocoa is the family default — 117 million cups deep.
The category leader at 116.9 million consumers and 52.5% penetration. Cultural affinity, family consumption occasions and availability across every retail channel power its dominance.
Universal appeal — Highest penetration across all demographic segments.
Family consumption — Strong household penetration with multi-user occasions — children’s mornings drive purchase.
Price accessibility — Wide price-point range enables true mass-market reach.
Local advantage — Nigeria’s cocoa production heritage supports authenticity and supply-chain efficiency.
| State | Region | Consumers | CDI | MAI | Strategic focus |
|---|---|---|---|---|---|
| Ogun | South West | 3,360,983 | 101.5 | 48.2 | Manufacturing proximity advantage |
| Oyo | South West | 4,368,485 | 102.7 | 43.8 | Volume leadership, distribution depth |
| Delta | South South | 3,866,281 | 118.7 | 40.3 | Regional anchor, trade partnerships |
Cocoa play: Defend the leadership where it is strongest: anchor production and supply chain in Ogun’s manufacturing corridor, drive volume in Oyo, and hold the South South through Delta.
Priority map — attractiveness meets development
Attractiveness meets development: four states earn the coffee spend.
Plotting the top 10 coffee markets on CDI against MAI separates genuine investment cases from mere volume — the same lens applies to tea and cocoa prioritization.
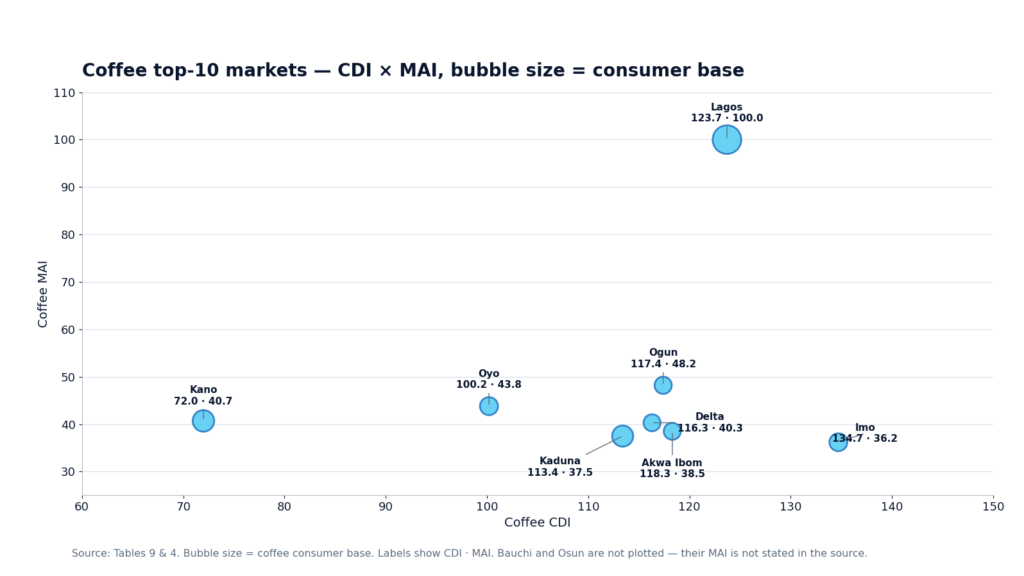
Beyond the quadrant lines: Osun (CDI 159) and Bauchi (CDI 131) show developed coffee demand without the economics to match — nurture them with distribution light-touch, and revisit as their MAI climbs. Kano is the reverse: attractive market, underdeveloped coffee culture — a build-and-develop brief.
6. Top 10 markets by category
Lagos headlines all three leaderboards — the North fills the volume ranks.
The top 10 markets per category, ranked by consumer numbers — the core of any national distribution strategy. CDI shown alongside to separate developed demand from raw volume.
| # | Coffee — State | Consumers | CDI |
|---|---|---|---|
| 1 | Lagos | 4,129,651 | 123.7 |
| 2 | Kano | 2,344,605 | 72.0 |
| 3 | Kaduna | 2,247,783 | 113.4 |
| 4 | Bauchi | 1,954,192 | 130.5 |
| 5 | Osun | 1,677,158 | 159.4 |
| 6 | Oyo | 1,642,636 | 100.2 |
| 7 | Imo | 1,608,169 | 134.7 |
| 8 | Ogun | 1,495,926 | 117.4 |
| 9 | Akwa Ibom | 1,460,507 | 118.3 |
| 10 | Delta | 1,459,299 | 116.3 |
| # | Tea — State | Consumers | CDI |
|---|---|---|---|
| 1 | Lagos | 7,418,258 | 108.1 |
| 2 | Kano | 6,823,048 | 101.9 |
| 3 | Kaduna | 4,414,533 | 108.3 |
| 4 | Katsina | 4,124,364 | 122.4 |
| 5 | Oyo | 3,845,442 | 114.2 |
| 6 | Bauchi | 3,787,843 | 123.1 |
| 7 | Jigawa | 3,060,987 | 108.2 |
| 8 | Rivers | 2,841,708 | 83.3 |
| 9 | Borno | 2,832,004 | 109.8 |
| 10 | Delta | 2,696,739 | 104.6 |
| # | Cocoa — State | Consumers | CDI |
|---|---|---|---|
| 1 | Lagos | 8,546,516 | 98.6 |
| 2 | Kano | 6,513,472 | 77.0 |
| 3 | Kaduna | 5,507,361 | 107.0 |
| 4 | Katsina | 4,666,361 | 109.7 |
| 5 | Oyo | 4,368,485 | 102.7 |
| 6 | Bauchi | 4,204,704 | 108.2 |
| 7 | Rivers | 4,129,676 | 95.9 |
| 8 | Jigawa | 3,903,541 | 109.3 |
| 9 | Delta | 3,866,281 | 118.7 |
| 10 | Borno | 3,605,347 | 110.7 |
The pattern behind the tables: Lagos, Kano and Kaduna appear in the top three of every category — they are non-negotiable distribution anchors. Northern volume states (Katsina, Bauchi, Jigawa, Borno) carry developed tea and cocoa demand (CDI 108–123) at low MAI: serve them with value formats through traditional trade, not premium pushes.
7. Behavioural shifts & consumption drivers
Three categories, three different reasons to drink.
The drivers behind each category point to different messages, channels and pack strategies.
Coffee — the professional ritual: Urbanization and modern retail pull coffee up; workplace culture (banking access r = 0.68) and premium experience-seeking sustain it. Lagos leads coffee CDI at 123.7 on 87.4% internet penetration.
Tea — wellness meets tradition: Health consciousness lifts green and herbal variants in middle-class states, while the North East holds the highest tea penetration (45.3%) on cultural continuity. Affordability keeps frequency high.
Cocoa — the family fuel: Nutritional positioning (energy, vitamins) wins family purchase decisions; children’s morning occasions drive household volume. Local cocoa heritage reinforces authenticity.
| Macro indicator | Coffee | Tea | Cocoa |
|---|---|---|---|
| GDP per capita | Strong (0.72) | Moderate (0.45) | Weak (0.28) |
| Internet penetration | Strong (0.68) | Moderate (0.42) | Weak (0.22) |
| Banking access | Strong (0.65) | Moderate (0.38) | Weak (0.18) |
| Middle-class population | Strong (0.70) | Moderate (0.48) | Moderate (0.35) |
| Population density | Moderate (0.52) | Moderate (0.55) | Strong (0.62) |
Marketing implication: Coffee is a digital-first, premium message aimed at income. Cocoa is a mass-reach, family message aimed at density. Tea sits between — cultural media in the North, wellness media in the South.
8. Strategic marketing directions
Priority 1 playbooks: maximum force on few fronts.
Priority 1 markets combine high attractiveness with above-average development — they warrant maximum investment as innovation hubs and brand-building platforms.
| State | Coffee — Focus | Invest |
|---|---|---|
| Lagos | Premium hub · café partnerships, premium SKUs, digital | Highest |
| Ogun | Distribution · trade hub, logistics optimization | High |
| Oyo | Urban penetration · Ibadan metro, modern trade | High |
| Delta | South South anchor · Warri development | Med-High |
| State | Tea — Focus | Invest |
|---|---|---|
| Lagos | Premium & modern trade · specialty teas | Highest |
| Oyo | Traditional strength · open markets, value packs | High |
| Kano | Northern volume hub · cultural positioning | High |
| Delta | South South expansion · local partnerships | Med-High |
| State | Cocoa — Focus | Invest |
|---|---|---|
| Ogun | Manufacturing proximity · supply chain hub | Highest |
| Oyo | Volume leadership · promotional intensity | High |
| Delta | South South anchor · trade partnerships | High |
Priority 2 — Build & Develop: Coffee (3): Akwa Ibom, Imo, Kaduna — urban centres and professional segments. Tea (4): Akwa Ibom, Imo, Kaduna, Ogun — expand distribution, build awareness. Cocoa (6): Akwa Ibom, Edo, Imo, Kaduna, Lagos, Rivers — leverage existing infrastructure.
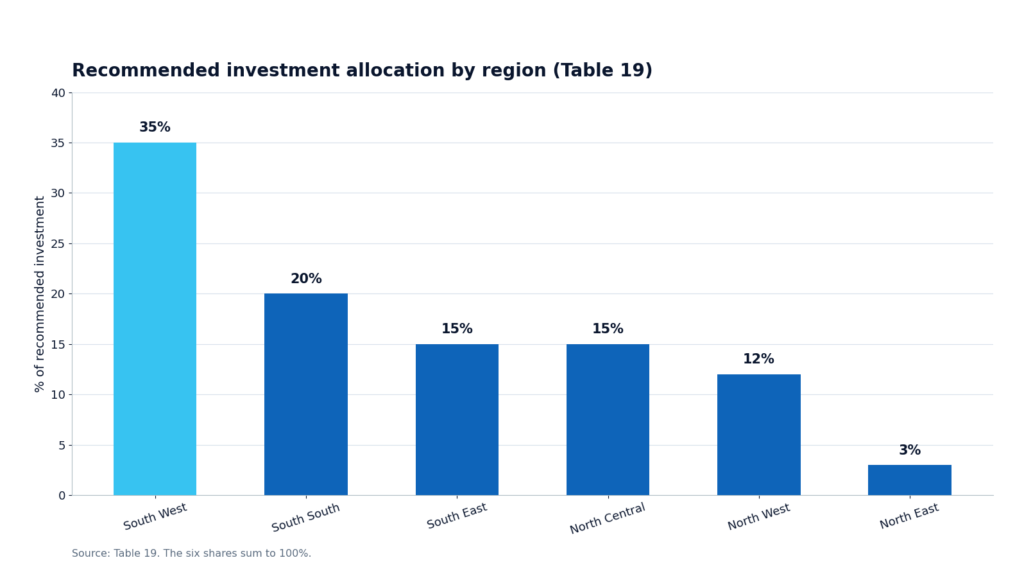
Budget follows attractiveness: 55% to the southern corridor
Regional strategies align resource allocation with each region’s role in the portfolio.
| Region | MAI score | Strategic priority | Resource allocation |
|---|---|---|---|
| South West | 44.5 | Leadership & innovation | 35% of budget |
| South South | 34.3 | Growth & expansion | 20% of budget |
| South East | 28.8 | Market development | 15% of budget |
| North Central | 23.6 | Selective investment | 15% of budget |
| North West | 16.5 | Volume focus (Kano / Kaduna) | 12% of budget |
| North East | 8.4 | Maintenance & monitoring | 3% of budget |
Regional hub model: Establish distribution and marketing hubs in Lagos (South West), Port Harcourt (South South) and Kano (North West) to optimize deployment — premium innovation flows from Lagos, volume coverage radiates from Kano.
9. Macro-economic context
A two-speed economy sets the beverage agenda.
Macro indicators explain the market map: southern regions offer premium growth while northern regions offer volume at lower price points. Strategies must differ by design.
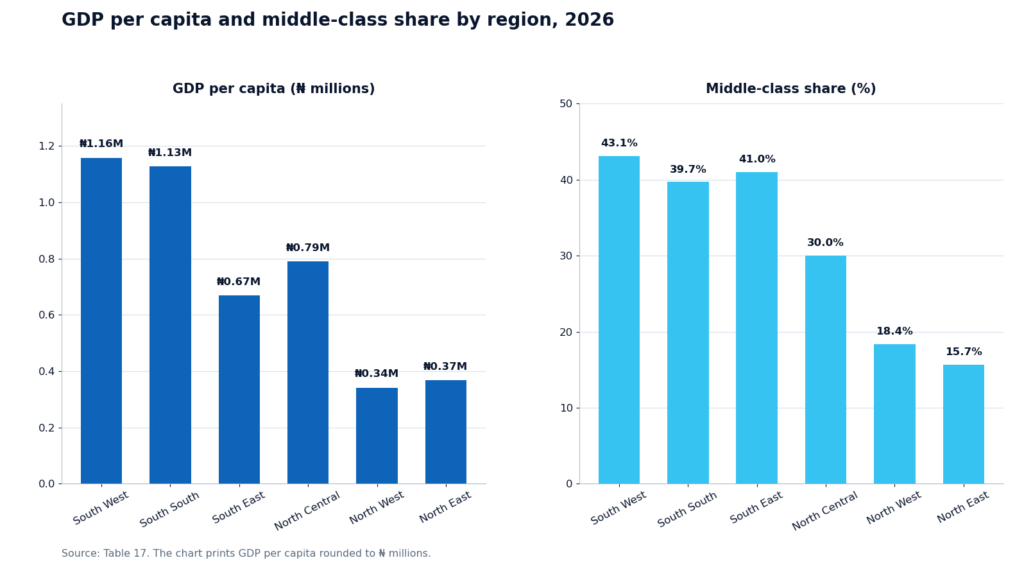
| Region | GDP / capita (₦) | Internet | Banking | Unemployment | GDP growth | Middle class |
|---|---|---|---|---|---|---|
| South West | 1,158,084 | 59.1% | 73.8% | 4.5% | 3.9% | 43.1% |
| South South | 1,127,783 | 48.2% | 69.4% | 6.6% | 3.7% | 39.7% |
| South East | 669,879 | 46.7% | 67.9% | 5.1% | 3.4% | 41.0% |
| North Central | 789,586 | 47.4% | 54.5% | 5.5% | 3.3% | 30.0% |
| North West | 341,838 | 34.2% | 38.9% | 6.8% | 3.1% | 18.4% |
| North East | 368,496 | 29.1% | 37.4% | 7.3% | 2.8% | 15.7% |
Digital divide: Internet penetration runs 29.1% → 59.1% (North East → South West) — digital marketing and e-commerce play unevenly.
Financial inclusion gap: Banking access spans 37.4% → 73.8% — shaping payment systems and premium accessibility.
Spending power: North East (7.3%) and North West (6.8%) unemployment limits discretionary spend on premium beverages.
Four economic tiers, four portfolio postures
Grouping states by economic profile converts macro data into portfolio decisions — differentiated products and pricing for a two-speed Nigeria.
| Tier | States | Economic profile | Strategic approach |
|---|---|---|---|
| Premium | Lagos, Abuja, Rivers | High GDP / capita, high banking access | Premium products, modern trade focus |
| Growth | Ogun, Oyo, Delta, Akwa Ibom | Moderate-high GDP, growing middle class | Mid-tier products, distribution expansion |
| Volume | Kano, Kaduna, Imo | Large population, lower GDP / capita | Value products, traditional trade |
| Emerging | Remaining states | Developing infrastructure | Selective presence, market development |
The strategic read: The South West’s leadership — ₦1.16M GDP per capita and a 43.1% middle class — drives premium category growth, coffee above all. South West and South South lead GDP growth (3.7–3.9%), meaning purchasing power keeps expanding where the portfolio is already strongest.
10. Conclusions & recommendations
Focus wins: concentrate where attractiveness and development meet.
Across 254.5 million consumers, the market rewards disciplined focus: cocoa for reach, tea for resilience, coffee for premium growth — deployed state by state, not nationally by default.
| Stat | Value |
|---|---|
| Priority 1 markets across the three categories | 7 |
| Priority 2 markets to build and develop | 13 |
| Markets to monitor for future entry | 21 |
Now · 0–6 months: Consolidate Priority 1: maximize distribution and promotional intensity in Lagos, Ogun, Oyo, Delta (all categories) and Kano (tea); prioritize Ogun manufacturing proximity for cocoa. Deploy category-specific plays and stand up the Lagos, Port Harcourt and Kano hubs.
Next · 6–18 months: Develop Priority 2: expand Kaduna, Akwa Ibom, Imo and Edo. Launch the innovation pipeline — premium coffee variants, specialty teas — from the Lagos hub outward.
Later · 18+ months: Open the frontier: invest in South East market development, build local supply-chain capability in Ogun’s corridor, and optimize region-specific portfolios for the two-speed economy.
Measure share, distribution and CDI — not just sales
Market share — Category share in Priority 1 markets — target 25%+ within 24 months.
Distribution — Weighted distribution in priority markets — target 70%+ coverage.
CDI growth — Category Development Index improvement across Priority 2 markets.
Revenue & margin — Year-on-year growth by region and category; gross margin by market tier.
| Region | Allocation | Focus areas | Expected ROI |
|---|---|---|---|
| South West | 35% | Lagos premium, Ogun / Oyo volume | High |
| South South | 20% | Delta anchor, Rivers expansion | High |
| South East | 15% | Market development, Imo focus | Medium-High |
| North Central | 15% | Abuja premium, selective expansion | Medium |
| North West | 12% | Kano volume, Kaduna development | Medium |
| North East | 3% | Maintenance, monitoring | Low-Medium |
Final recommendation: Focus 55% of resources on the South West and South South — establishing Lagos as the innovation and brand-building hub while building volume leadership in Oyo, Ogun and Delta. Maintain selective presence in the North West through Kano and Kaduna for volume, and monitor the remaining regions for future expansion as their economics develop.
About the author
Jim Ikpehai — Managing Consultant, Mediology Nigeria Limited, Lagos, Nigeria. Results-driven marketing communications strategist with over 15 years of experience in brand building, brand development and management. A trusted consultant to global and local brands including Samsung, Reliance HMO, Polo Swarovski, FBN Holdings, M-KOPA, Honda Nigeria, Daraju Industries and De Trans — delivering 360° marketing, communication strategies, media planning and buying, digital marketing, SEO, content strategy and marketing analytics.
Career highlights: Managing Consultant — Mediology Nigeria Ltd (2025–present); Director of Planning & Strategy — Solid Media Nigeria (2022–2025); Head, Media Planning & Strategy — HoiSales Nigeria (2020–2022); Head, Planning / Insight & Analytics — All Seasons Zenith (Publicis Groupe), Lagos (2014–2020); Senior Manager, Research / Planning & Innovation — All Seasons Zenith (Publicis), 2013–2014; Manager, Data Analytics & Innovation — MediaCom (WPP), 2011–2013.
Education: Ph.D. Economics — Sustainable Growth & Development (in view), University of Lagos; M.Sc. Economics — Growth & Development, Monetary & Energy Economics, University of Lagos; B.Sc. Economics — University of Lagos; Level 6 Diploma in Strategic Marketing — Chartered Institute of Marketing (CIM), UK.
Memberships & recognition: Juror, Young Lions National Competition (Cannes Lions pathway) — 2024 & 2025; Juror, Pitcher Awards — 2024; Panelist, Social Media Week Lagos — 2019; Fellow, Institute of Management Consultants of Nigeria (FIMC); Associate Member, Advertising Practitioners Council of Nigeria (APCON); Member, Chartered Institute of Marketing (CIM), UK.
Contact: jim@mediologyng.com · +234 703 630 0230 · linkedin.com/in/jimikpehai75564295 See our Services page for the six integrated disciplines behind this approach.
Frequently asked questions
How big is Nigeria’s hot beverage market?
Nigeria has 254.5 million hot beverage consumers across three categories, drawn from a national population of 222.6 million: cocoa leads at 116.9 million consumers (52.5% penetration), tea follows at 92.6 million (41.6%), and coffee — the premium growth lane — at 45.0 million (20.2%).
Which state should a hot beverage brand enter first?
Lagos. It scores a perfect 100 on the Market Attractiveness Index — no other state clears 60 — and headlines all three category leaderboards. The report’s Priority 1 markets are Lagos, Ogun, Oyo and Delta for coffee, Lagos, Oyo, Kano and Delta for tea, and Ogun, Oyo and Delta for cocoa, all in the South West except Delta and Kano.
Which category is the best investment?
It depends on the objective: cocoa for reach — 116.9 million consumers at 52.5% penetration, the family default across every region; coffee for premium growth — 20.2% penetration concentrated in urban, economically advanced states, with Lagos coffee CDI at 123.7; tea for resilience — 92.6 million consumers, culturally anchored in the North and steady across regions.
Where is the biggest growth opportunity?
The South East. It trails on all three categories and sits below 90 on the development index in every category — undeveloped across the board, the clearest long-term growth opportunity. The North West offers volume now through Kano and Kaduna, despite lower per-capita metrics.
Where can I get the full report?
The full 23-page Hot Beverage Drinks Market Analysis — Nigeria is available to download below. For a tailored reading of the findings for your business, or a state-level deep dive, contact Mediology Nigeria at info@mediologyng.com or visit 1 Montgomery Road, Yaba, Lagos.
This report was prepared by Jim Ikpehai, Mediology Nigeria — data-driven marketing communications excellence. For the full analysis, including every market ranking and the underlying data, download the complete report below.