
Strategic Marketing Intelligence — Analysis Series. Prepared by Jim Ikpehai, Mediology Nigeria. Published April 2026.
Nigeria’s fintech market is projected to reach USD 4.24 billion by 2033, growing at a compound annual growth rate of 15.8% from a base of USD 1.13 billion in 2024. With 430+ fintech startups and a top nine valued at a combined $10.6 billion, Nigeria has cemented its position as Africa’s fintech powerhouse — but the opportunity is far from evenly spread. Lagos, with a Fintech Score of 97.8, is the undisputed hub, followed by Abuja (FCT) at 61.1 and Ogun State at 59.4, and the South West region accounts for 65% of total market penetration.
This report — the Nigerian Fintech Market Prioritisation & Attractiveness Analysis — is a comprehensive evaluation of market attractiveness, whitespace opportunity and entry strategy, assessed through the PESTLE, CDI Growth Model, GE–McKinsey Matrix and BCG frameworks. It is built to guide state and regional market prioritisation for new entrants, existing players and investors.
The headline finding: Lagos is Nigeria’s number one priority market for fintech investment, and the single biggest untapped opportunity sits outside the cities — rural financial inclusion alone is a $42 billion whitespace pool, part of ten pools the report values at a combined $290B+. The market has entered what the report calls its discipline era: growth is real, but it now rewards sustainable unit economics, robust risk management and differentiated value over growth at all costs.
At a glance:
- $4.24 billion — projected market size by 2033, from $1.13 billion in 2024
- 15.8% — compound annual growth rate, 2025–2033
- 430+ — fintech startups operating in Nigeria
- $10.6 billion — combined valuation of the top nine fintechs (January 2026)
- 97.8 — Lagos Fintech Score, the highest in the country
- 7.8/10 — the report’s overall market attractiveness score for Nigeria
1. Executive summary
Africa’s fintech powerhouse is entering its discipline era.
The Nigerian fintech sector represents one of Africa’s most dynamic and rapidly evolving financial-technology ecosystems. With a market size projected to reach USD 4.24 billion by 2033, growing at a compound annual growth rate (CAGR) of 15.82%, Nigeria continues to cement its position as the continent’s fintech powerhouse.
Market leadership — Nigeria accounts for 28% of all African fintech companies and captured 36% of fintech funding between 2020 and H1 2024.
Investment attraction — Top 9 fintechs valued at $10.6B; Nigeria regained its position as Africa’s top VC destination in 2024.
Digital transformation — Cash transactions dropped from 91% (2019) to 55% (2023); digital payments now represent 52% of transactions.
Financial inclusion — The gender gap in mobile-money ownership narrowed from 46% (2023) to 25% (2025).
This analysis employs established strategy frameworks — PESTLE analysis, the Category Development Index (CDI) Growth Model, the GE–McKinsey Matrix and the Boston Consulting Group (BCG) Matrix — to evaluate market attractiveness, identify whitespace opportunities, and provide strategic guidance for new market entrants and existing players seeking expansion.
The report reveals significant regional disparities in fintech adoption, with Lagos State emerging as the undisputed hub (Fintech Score: 97.8), followed by Abuja FCT (61.1) and Ogun State (59.4). The South West region dominates with the highest concentration of fintech activity, accounting for 65% of total market penetration.
2. Market overview and key metrics
A $1.13B market compounding at 15.8% through 2033.
| Metric | Value | Note |
|---|---|---|
| Market size 2024 | $1.13B | Base year |
| Projected market size 2033 | $4.24B | +275% growth |
| CAGR 2025–2033 | 15.8% | Above Africa average |
| Fintech startups | 430+ | +70% in 2024 |
| Transaction value 2024 | $2.03T | +39% YoY |
| Transaction volume 2024 | 44.8B | +16% YoY |
The Nigerian fintech market has demonstrated remarkable resilience and growth despite macroeconomic challenges. According to IMARC Group’s latest research, the market reached USD 1.13 billion in 2024 and is projected to grow to USD 4.24 billion by 2033. This trajectory is underpinned by four structural drivers:
- 1. Rising smartphone penetration. Nigeria’s smartphone user base is projected to exceed 140 million by end of 2025, creating a massive addressable market for mobile-first financial services.
- 2. Regulatory support. The Central Bank of Nigeria’s cashless policy, Open Banking framework and Payment Service Bank licensing have created an enabling environment for fintech innovation.
- 3. Youthful demographics. With a median age of 18 years and a population over 200 million, Nigeria represents one of the world’s largest underserved markets.
- 4. Financial-inclusion imperative. The current financial-inclusion rate stands at 64.1%, with the CBN targeting 95% through digital channels.
Nine champions anchor a $10.6B valuation pool
The Nigerian fintech ecosystem is characterised by a diverse mix of homegrown champions and international players. The top 9 fintech companies are now valued at a combined $10.6 billion as of January 2026.
| Company | Valuation | Primary Segment | Key Strength |
|---|---|---|---|
| Flutterwave | $3.0B | Payment infrastructure | Pan-African reach, enterprise focus |
| OPay | $2.75B | Mobile money | Consumer adoption, super-app strategy |
| Moniepoint | $1.0B | SME payments | Agent network, merchant services |
| Interswitch | $1.0B | Payment switching | Infrastructure, Verve card network |
| PalmPay | $850M | Mobile financial services | User acquisition, rewards ecosystem |
| Moove | $750M | Mobility finance | Vehicle financing, gig economy |
| Kuda | $500M | Digital banking | Neobank experience, zero fees |
| Paystack | $500M | Payment gateway | Developer experience, Stripe backing |
| Paga | $250M | Mobile payments | Financial inclusion, agent network |
Transaction value has doubled in eight quarters
Electronic payment transaction value tracked by NIBSS climbed every quarter through 2023–2024, closing 2024 at ₦108 trillion in Q4 — more than double the ₦45 trillion recorded in Q1 2023. Momentum of this order signals that digital rails, not cash, now carry the Nigerian economy’s growth.
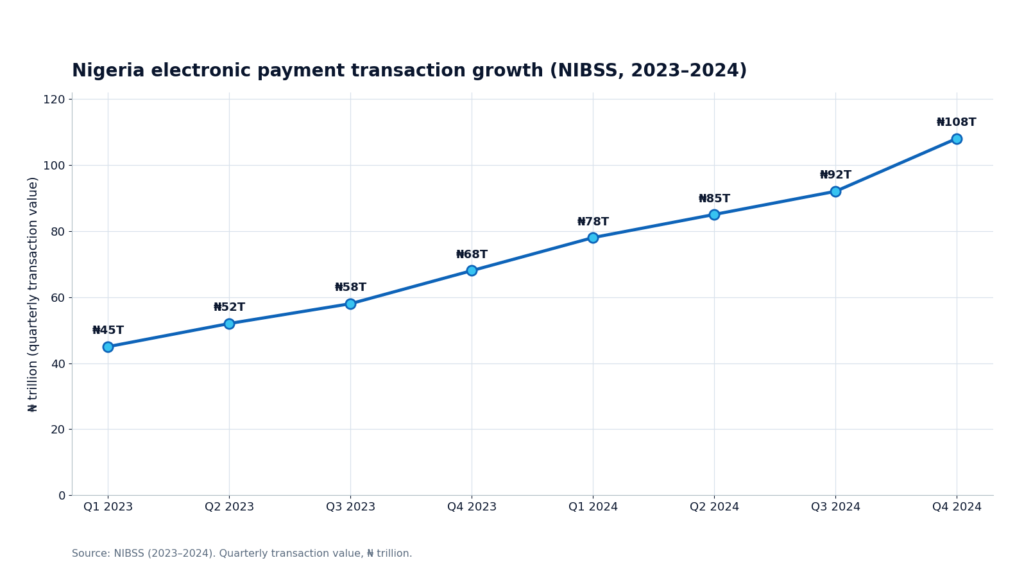
Reading the curve: Quarterly growth never fell below ₦6T across the period. The acceleration from Q4 2023 (₦68T) to Q4 2024 (₦108T) — a 59% year-on-year step — coincides with the CBN’s cashless-policy enforcement and the mass onboarding of agent-banking networks beyond the major cities.
3. PESTLE analysis
Technology leads the macro scan; the economy is the watch item.
The PESTLE framework provides a comprehensive evaluation of the macro-environmental factors influencing the Nigerian fintech sector. Our analysis reveals a generally favourable environment with specific areas requiring strategic attention.
| Dimension | Score (out of 10) | Headline | Watch item |
|---|---|---|---|
| Political | 6.5 | Government commitment to a cashless economy; CBN’s supportive regulatory stance | Political instability in some regions; policy-inconsistency risk |
| Economic | 5.8 | 4.6% GDP growth in Q4 2024; growing middle class | Currency volatility; high inflation (19.5% average) |
| Social | 7.2 | Youthful, tech-savvy population; rising digital literacy | Urban–rural digital divide; trust deficit in digital finance |
| Technological | 8.5 | 87% mobile penetration; advanced NIP payment infrastructure; Open Banking framework launched; AI/ML adoption accelerating | — |
| Legal | 7.0 | Comprehensive CBN regulations; SEC VASP framework established; Data Protection Act 2024 | Multi-regulator complexity |
| Environmental | 6.0 | Green fintech emerging; ESG considerations growing | Infrastructure climate risks; opportunity in sustainable finance |
Key PESTLE insight: The technological dimension scores highest (8.5/10), reflecting Nigeria’s robust digital infrastructure and innovation ecosystem. Economic volatility (5.8/10) remains the principal concern, requiring fintechs to build resilient business models capable of withstanding currency fluctuation and inflationary pressure.
4. CDI growth model analysis
Where penetration meets velocity: the category map.
The Category Development Index (CDI) Growth Model evaluates fintech segments on market penetration and growth velocity, providing a framework for resource allocation and strategic prioritisation.
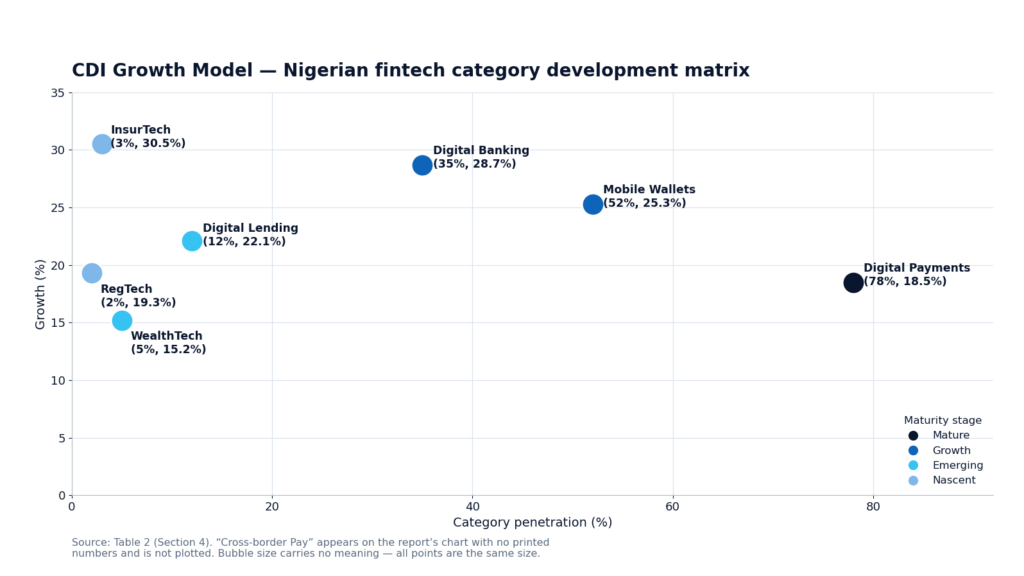
| Segment | Penetration | Growth Rate | Maturity Stage | Strategic Priority |
|---|---|---|---|---|
| Digital Payments | 78% | 18.5% | Mature | Defend & optimise |
| Mobile Wallets | 52% | 25.3% | Growth | Invest & expand |
| Digital Banking | 35% | 28.7% | Growth | Invest & expand |
| Digital Lending | 12% | 22.1% | Emerging | Selective investment |
| WealthTech | 5% | 15.2% | Emerging | Monitor & learn |
| InsurTech | 3% | 30.5% | Nascent | Early entry |
| RegTech | 2% | 19.3% | Nascent | Early entry |
The CDI analysis reveals three distinct strategic zones — star segments, emerging opportunities and mature markets.
Star segments — high penetration, high growth
Mobile wallets and digital banking represent the optimal investment zones, combining established market presence with continued expansion potential. Mobile wallets show exceptional promise with 25.3% growth and 52% penetration — strong consumer-adoption momentum.
Emerging opportunities — low penetration, high growth
InsurTech presents the most compelling whitespace: 30.5% growth against only 3% penetration. The USD 1.2 billion addressable market for SME-focused digital insurance remains largely untapped.
Mature markets — high penetration, moderate growth
Digital payments, while mature, continue to offer optimisation opportunities through value-added services and cross-selling into lending, savings and investments.
Portfolio guidance
Weight capital toward the growth quadrant, seed the nascent categories with option-value bets, and harvest payment incumbency to fund both.
5. GE–McKinsey matrix — regional market evaluation
Regional attractiveness is a one-city story — for now.
The GE–McKinsey Matrix evaluates regional markets across two dimensions — market attractiveness and competitive strength — enabling prioritised market-entry and expansion strategies.
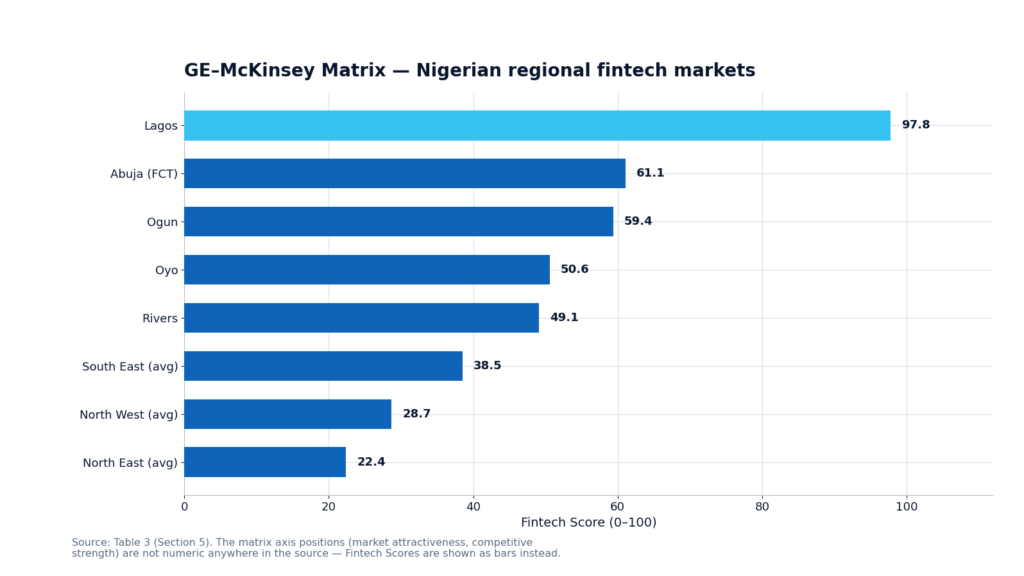
| Region | Population (M) | Internet Pen. | Banking Access | Middle Class (M) | Fintech Score | Priority |
|---|---|---|---|---|---|---|
| Lagos | 16.6 | 87.4% | 89.4% | 11.1 | 97.8 | Priority 1 |
| Abuja (FCT) | 5.1 | 83.2% | 84.6% | 3.5 | 61.1 | Priority 2 |
| Ogun | 6.8 | 74.5% | 79.2% | 4.2 | 59.4 | Priority 2 |
| Oyo | 7.9 | 68.2% | 74.3% | 3.8 | 50.6 | Priority 3 |
| Rivers | 7.6 | 66.1% | 78.1% | 3.8 | 49.1 | Priority 3 |
| South East (avg) | 29.1 | 46.7% | 67.9% | 13.3 | 38.5 | Priority 3 |
| North West (avg) | 61.6 | 34.2% | 38.9% | 9.1 | 28.7 | Priority 4 |
| North East (avg) | 34.5 | 29.1% | 37.4% | 4.3 | 22.4 | Priority 4 |
Invest & grow — high priority
Lagos is the singular market in this zone, commanding a 97.8 attractiveness score. The state accounts for 35% of national fintech transaction value and hosts the headquarters of the major players.
Selective investment — medium priority
Abuja FCT and Ogun State offer expansion opportunities with moderate competition and growing digital adoption — natural second markets once the Lagos playbook is proven.
Harvest / divest — low priority
Northern regions present long-term potential but require significant infrastructure investment and face security challenges. Enter through partnerships and agent networks rather than owned infrastructure.
Sequencing rule
Win Lagos decisively, replicate in Abuja and the wider South West, then extend North with hybrid digital-physical models as infrastructure matures.
6. BCG matrix — segment portfolio analysis
One Star, one Cash Cow, and a field of Question Marks.
The Boston Consulting Group (BCG) Matrix classifies fintech segments on relative market share and growth rate, providing guidance for portfolio resource allocation.
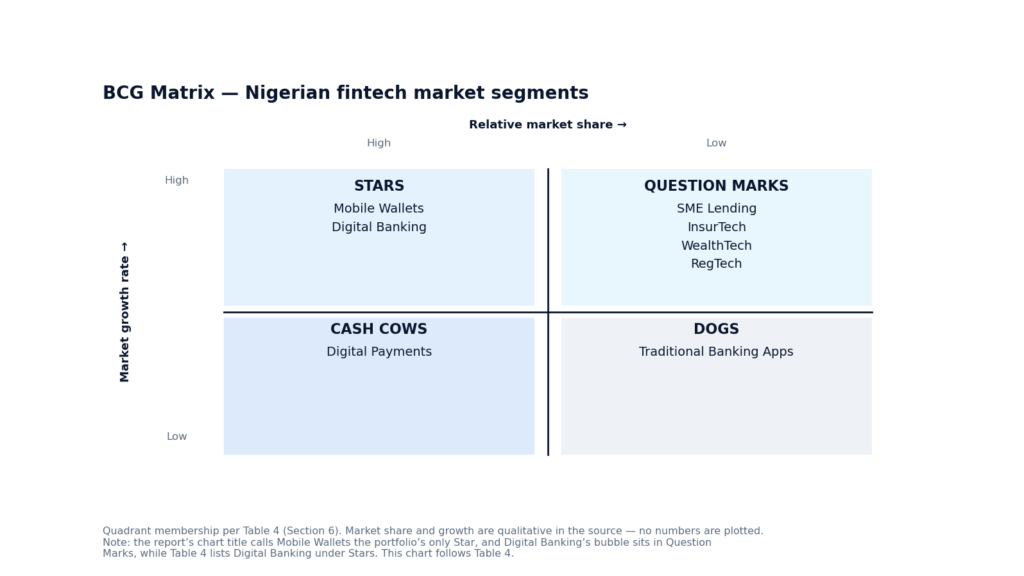
| Quadrant | Segments | Characteristics | Strategy |
|---|---|---|---|
| Stars | Mobile Wallets, Digital Banking | High growth, high share | Invest for dominance |
| Cash Cows | Digital Payments | Low growth, high share | Milk for reinvestment |
| Question Marks | SME Lending, InsurTech, WealthTech, RegTech | High growth, low share | Selective investment |
| Dogs | Traditional Banking Apps | Low growth, low share | Divest or reposition |
Stars — mobile wallets & digital banking
These segments warrant continued investment to maintain market leadership. OPay’s $2.75B valuation and Kuda’s rapid user growth to 4M+ demonstrate the potential. Focus on user acquisition, feature expansion and ecosystem lock-in.
Cash cows — digital payments
With 78% penetration and established infrastructure, digital payments generate stable revenue streams. Flutterwave and Paystack should focus on margin optimisation, cross-border expansion and value-added services.
Question marks — SME lending, InsurTech, WealthTech
These high-growth, low-penetration segments are the primary whitespace opportunities. The $32.2B SME financing gap and the $1.2B InsurTech market warrant strategic bets with a clear path to profitability.
Dogs — traditional banking apps
Legacy bank apps with low growth and low share should be repositioned around superior UX and ecosystem integration — or divested in favour of fintech partnerships.
7. Consumer behavioural shifts
The cash-to-digital migration is structural.
Understanding evolving consumer behaviour is critical for fintech product development and market positioning. Nigeria has witnessed a profound transformation in payment preferences over the past five years.
Nigeria consumer payment behaviour shift (2019–2026E)
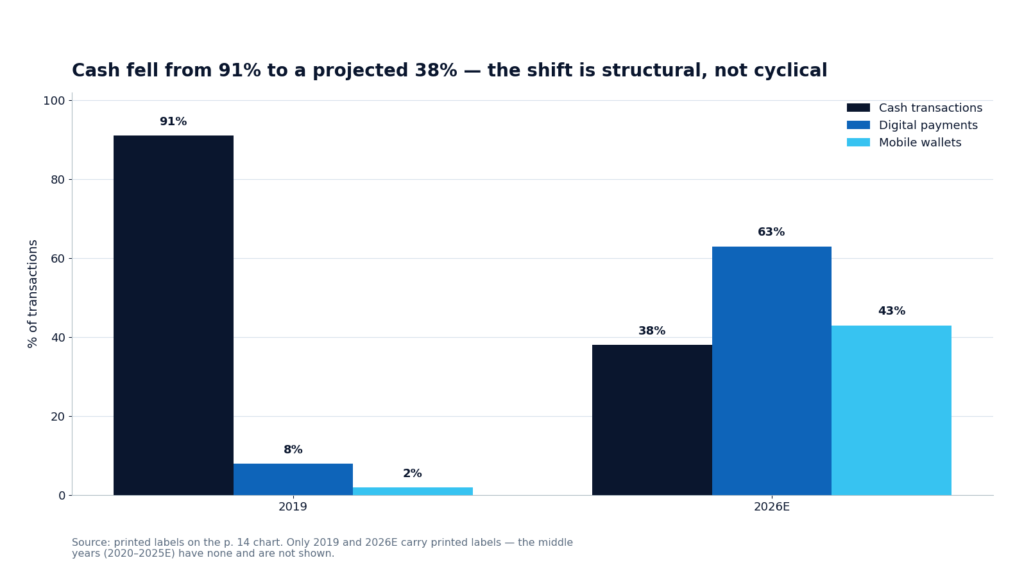
- 1. Accelerated digital adoption. Cash transactions have declined from 91% in 2019 to a projected 38% by 2026. The COVID-19 pandemic and the CBN’s cashless policy served as catalysts, but the shift has proven structural rather than temporary.
- 2. Mobile-first preference. Mobile applications now represent the dominant channel for digital payments, with over 30 million mobile-wallet users in 2023 and year-on-year growth exceeding 60%. Platforms like OPay, PalmPay and Paga are reshaping the landscape.
- 3. Gender-gap reduction. The gender gap in mobile-money account ownership declined significantly — from 46% in 2023 to 25% in 2025 — driven by a 21-percentage-point increase in women’s account ownership.
- 4. Super-app expectations. Consumers increasingly expect integrated financial services within single platforms. The convergence of payments, savings, lending and investments is driving platform consolidation.
Behavioural challenge — trust deficit: Despite rapid adoption, a trust deficit persists around transaction failures, fraud and dispute resolution. Sustained growth depends on robust security measures and consumer education as much as on product innovation.
8. Category entry points and whitespace opportunities
Ten whitespace pools worth a combined $290B+.
Analysis of market gaps reveals significant whitespace opportunities for new entrants and expansion-minded incumbents.
| Opportunity | Addressable Market | Impact | Market Gap |
|---|---|---|---|
| Rural financial inclusion | $42B | High | 85% of the rural population underserved |
| SME credit scoring | $38B | High | 75% of SMEs lack formal credit access |
| Agricultural finance | $35B | Medium | 70% of farmers unbanked; entry via seasonal loans, supply-chain integration |
| Microinsurance | $32B | High | 65% insurance-penetration deficit; entry via embedded insurance, parametric products |
| Islamic finance | $25B | Medium | 50% of the Northern population; entry via Sharia-compliant products, ethical investing |
| Pension tech | $22B | Medium | 45% informal sector uncovered; entry via micro-pensions, gig-worker solutions |
Strategic entry recommendations
- 1. Rural financial inclusion. The 35% vs 65% North–South fintech-access disparity represents the largest addressable gap. Success requires hybrid digital-physical models leveraging agent networks and simplified USSD channels.
- 2. SME digital lending. With only 12% digital-lending penetration among SMEs, opportunity exists for AI-powered credit scoring using alternative data sources. Carbon’s 85% loan-approval accuracy using AI algorithms demonstrates the model.
- 3. InsurTech. The $1.2 billion market is driven by increasing SME awareness (65% now recognise insurance importance) and government mandates requiring basic coverage.
9. Investment risk analysis
The reward is real — so are the risks.
Comprehensive risk assessment is essential for informed investment decisions in Nigeria’s fintech sector.
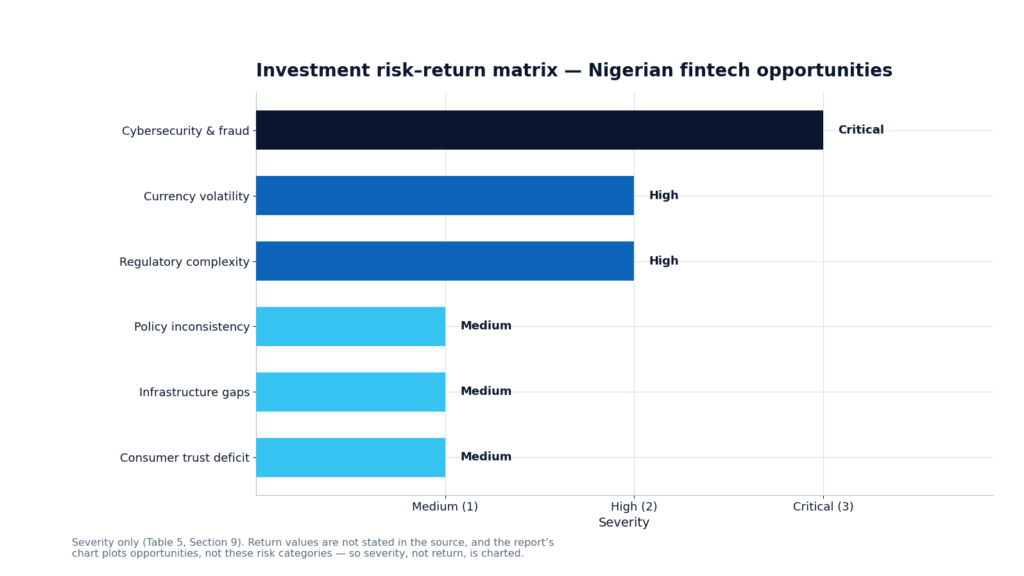
| Risk Category | Severity | Mitigation Strategy |
|---|---|---|
| Cybersecurity & fraud | Critical | Security-first architecture, incident-response capability, continuous monitoring |
| Currency volatility | High | Resilient unit economics, FX-hedged pricing, USD-linked revenue lines |
| Regulatory complexity | High | Early compliance investment, multi-regulator engagement, RegTech tooling |
| Policy inconsistency | Medium | Scenario planning, diversified product portfolio, government relations |
| Infrastructure gaps | Medium | Offline-first design, USSD fallbacks, agent-network distribution |
| Consumer trust deficit | Medium | Transparent communication, fast dispute resolution, consumer education |
Critical risk alert — Cybersecurity: Cyber attacks on Nigerian financial institutions surged 153% between 2020 and 2024, with ransomware incidents increasing 287%. The fintech sector remains especially vulnerable — Flutterwave lost ₦11 billion in April 2024 and Interswitch lost ₦30 billion in 2023 to system glitches. Investors must prioritise cybersecurity infrastructure and incident-response capabilities.
Funding landscape: Nigerian fintech funding declined 17.1% to $331M in 2024, reflecting global VC caution. However, the sector maintained its leadership position — 35% of total tech investment and 72% of equity investments in Nigeria. Notable deals included Moniepoint’s $110M Series C and Paystack’s acquisition of Brass. Venture debt is rising as an alternative: $755M raised in 2024, up from $633M in 2023.
10. Strategic recommendations
Different playbooks for different players.
For new market entrants
- 1. Focus on whitespace segments. InsurTech, agricultural finance and rural inclusion offer the highest opportunity-to-competition ratios. Avoid saturated mobile-wallet and payment-gateway markets unless possessing significant differentiation.
- 2. Prioritise Lagos, expand selectively. Establish initial operations in Lagos to access talent, infrastructure and customers. Use proven models for expansion into Abuja and South West states before considering Northern markets.
- 3. Build trust-first. Invest disproportionately in security infrastructure, regulatory compliance and transparent communication. Trust deficits represent the primary barrier to adoption.
For existing players
- 1. Pursue strategic consolidation. The market is entering a consolidation phase. Acquire complementary capabilities (e.g., Paystack acquiring Brass) to build ecosystem moats.
- 2. Expand into adjacent segments. Payment players should explore lending (transaction-data advantage). Lending platforms should consider insurance and wealth management.
- 3. Invest in AI/ML capabilities. From credit scoring to fraud detection, AI represents the next competitive frontier. Carbon’s 85% loan-approval accuracy demonstrates the edge.
For investors
- 1. Diversify across the risk-return spectrum. Balance Stars (mobile wallets) with Question Marks (InsurTech) for portfolio resilience.
- 2. Prioritise unit economics. With funding tightening, focus on startups with clear paths to profitability rather than growth-at-all-costs metrics.
- 3. Consider venture debt. With $755M raised via venture debt in 2024 (up from $633M in 2023), non-dilutive financing options are increasingly viable.
11. Conclusion
A compelling market that now rewards discipline.
The Nigerian fintech sector stands at an inflection point. With a projected market size of $4.24 billion by 2033, supported by favourable demographics, regulatory tailwinds and accelerating digital adoption, the fundamentals remain compelling. However, the landscape is evolving from a “growth at all costs” phase to one demanding sustainable unit economics, robust risk management and differentiated value propositions.
Our analysis using the PESTLE, CDI Growth Model, GE–McKinsey Matrix and BCG frameworks reveals:
- Market leadership opportunities. Lagos dominates with a 97.8 attractiveness score, but Abuja and South West states offer expansion potential.
- Segment prioritisation. Mobile wallets and digital banking are Stars warranting continued investment; InsurTech and SME lending represent high-growth Question Marks.
- Whitespace potential. Rural inclusion, agricultural finance and microinsurance offer $100B+ in combined addressable markets.
- Risk-management imperative. Cybersecurity, currency volatility and regulatory complexity require proactive mitigation strategies.
For stakeholders willing to navigate these complexities, Nigeria’s fintech sector offers unparalleled opportunities to drive financial inclusion while generating attractive returns. The convergence of technological capability, regulatory support and market demand creates a window for building category-defining businesses that will shape Africa’s financial future.
Final assessment — 7.8/10 attractiveness: Nigeria’s fintech market receives an overall attractiveness score of 7.8/10, reflecting strong growth potential tempered by operational challenges. The market is recommended for strategic entry by well-capitalised players with strong risk-management capabilities and long-term investment horizons.
12. References
- [1] IMARC Group. (2025). Nigeria Fintech Market: Industry Trends, Share, Size, Growth, Opportunity and Forecast 2025–2033. IMARC Group Research.
- [2] Jackson, Etti & Edu. (2025). Nigeria’s Financial Sector: Trends and Emerging Opportunities. Jackson, Etti & Edu Financial Services.
- [3] Central Bank of Nigeria. (2023). Operational Guidelines for Open Banking in Nigeria. CBN Policy.
- [4] Ken Research. (2025). Nigeria FinTech and Neobank Ecosystem Market. Ken Research Industry.
- [5] Central Bank of Nigeria. (2024). Financial Inclusion Strategy 2019–2024. CBN.
- [6] Brandcom Nigeria. (2026, January 27). Nigeria’s Top 9 Fintechs Now Worth $10.6 Billion. Brandcom Nigeria Business.
- [7] Research and Markets. (2025). Nigeria Digital InsurTech Platforms for SMEs Market. Research and Markets Industry.
- [8] IFC. (2025). Handbook: MSME Banking in the Digital Era. International Finance Corporation.
- [9] Thunes. (2025, October). Nigeria: Building a Cash-lite Future. Thunes Insights.
- [10] Blueweave Consulting. (2024). Nigeria Digital Payments Market Size, Share & Trend Outlook 2031. Blueweave Consulting.
- [11] GSMA. (2026). State of the Industry Report on Mobile Money 2026. GSMA Industry.
- [12] Techcabal Insights. (2025, November). Is Cybercrime Outpacing Africa’s Digital Revolution? Techcabal Security.
- [13] WISS Journals. (2025). Exploring the Role of Financial Technology in SME Development in Nigeria. Wukari International Studies Journal, 9(4).
- [14] Stanford GSB. (2021, November). The Future of Debt: Can Fintech Fill the Gap? Stanford Graduate School of Business Insights.
- [15] National Insurance Commission. (2023). NAICOM Guidelines for Digital Insurance Providers. NAICOM Regulatory Document.
- [16] International Journal of Research and Innovation in Social Science. (2025). Analysis of Emerging Cybersecurity Threats in Nigeria’s Financial Sector. IJRISS, 9(7).
- [17] Agusto Research. (2025). 2025 Fintech Industry Report. Agusto & Co. Research.
- [18] Carbon. (2024). Annual Report: AI-Powered Lending in Nigeria. Carbon Fintech Publication.
- [19] Afrilabs. (2025, February). Venture Capital Investment Trends in Africa: 2024 Recap and 2025 Projections. Afrilabs Research.
About the author
Jim Ikpehai — Managing Consultant, Mediology Nigeria Limited, Lagos, Nigeria. Results-driven marketing communications strategist with over 15 years of experience in brand building, brand development and management, and the design of integrated marketing and advertising strategies. A trusted consultant to global and local brands — including Samsung, Reliance HMO, Polo Swarovski, FBN Holdings, M-KOPA, Honda Nigeria, Daraju Industries and De Trans Pharmaceuticals. He was part of the team that launched Wema ALAT — Nigeria’s first digital bank — and led planning for financial-services brands including Union Bank, Access Bank and Wema Bank, grounding this fintech analysis in first-hand category experience.
Career highlights: Managing Consultant, Mediology Nigeria Ltd (2025–present); Director of Planning & Strategy, Scout Media Nigeria (2023–2024); Head, Media Planning & Strategy, MediaCom Nigeria (WPP Global) (2022–2023); GM, Planning / Insight & Analytics, Mediology Nigeria Ltd (2019–2021); Head, Planning / Insight & Analytics, All Seasons Zenith (Publicis) (2018–2019); Senior Manager, Research / Planning & Innovation, All Seasons Zenith (Publicis) (2015–2017); Manager, Data Analytics & Innovation, MediaCom Nigeria (WPP) (2011–2014).
Education: Ph.D. Economics — Sustainable Growth & Development (in view), University of Lagos; M.Sc. Economics — Growth & Development, Monetary & Energy Economics, University of Lagos; B.Sc. Economics, University of Lagos; Level 6 Diploma in Strategic Marketing, Chartered Institute of Marketing (CIM), UK.
Memberships & recognition: Fellow, Institute of Management Consultants of Nigeria (FIMC); Associate Member, Advertising Practitioners Council of Nigeria (APCON); Member, Chartered Institute of Marketing (CIM), UK; Juror, Young Lions National Competition (Cannes Lions pathway), 2024 & 2025; Channel Jury Member, Pitcher Awards, 2024; Panelist, Social Media Week Lagos, 2019.
Contact: jim@mediologyng.com · +234 703 630 0230 · linkedin.com/in/jimikpehai75564295
See our Services page for the six integrated disciplines behind this approach.
Frequently asked questions
How big is Nigeria’s fintech market, and how fast is it growing?
The market reached USD 1.13 billion in 2024 and is projected to grow to USD 4.24 billion by 2033, a compound annual growth rate of 15.8% for 2025–2033.
Which market should a new fintech enter first?
Lagos. It commands a Fintech Score of 97.8 — the only Priority 1 market — accounts for 35% of national fintech transaction value, and hosts the headquarters of the major players. The report’s sequencing rule is to win Lagos decisively, replicate in Abuja (FCT) and the wider South West, then extend North with hybrid digital-physical models as infrastructure matures.
Which segments are the best investment zones?
Mobile wallets and digital banking are the Stars — high penetration and high growth — and warrant investment for dominance. The most compelling whitespace is InsurTech: 30.5% growth against only 3% penetration, with a USD 1.2 billion addressable market for SME-focused digital insurance still largely untapped. Digital payments, at 78% penetration, is the Cash Cow to milk for reinvestment.
What are the biggest risks in Nigerian fintech?
Cybersecurity and fraud is the only risk rated Critical: cyber attacks on Nigerian financial institutions surged 153% between 2020 and 2024, with ransomware incidents increasing 287%, and Flutterwave lost ₦11 billion in April 2024. Currency volatility and regulatory complexity are rated High; policy inconsistency, infras
Where can I get the full report?
The full 23-page Nigerian Fintech Market Prioritisation & Attractiveness Analysis is available to download below. For a tailored reading of the findings for your business, or a state-level deep dive, contact Mediology Nigeria at info@mediologyng.com or visit 1 Montgomery Road, Yaba, Lagos.
This report was prepared by Jim Ikpehai, Mediology Nigeria — data-driven marketing communications excellence. For the full analysis, including every market ranking and the underlying data, download the complete report below.