
Strategic Marketing Intelligence — Vol. 2, Strategic Analysis Series. Prepared by Jim Ikpehai, Mediology Nigeria. Published April 2026.
Nigeria’s seasoning category reaches 138.6 million users out of a population of 234.4 million — a national penetration rate of 59.1%. But that national figure hides a 33.9 percentage point spread between states, from 44.5% penetration in Yobe to 78.4% in Delta. Where a seasoning brand invests, in other words, matters as much as how much it invests.
This report — the Seasoning Market Attractiveness Index (MAI) Report 2026 — is a comprehensive analysis of Nigeria’s seasoning category, built to guide state and regional market prioritisation. It evaluates all 37 states and the six geopolitical regions through five complementary strategic frameworks: the BCG Growth-Share Matrix, the GE McKinsey Matrix, CDI-BDI analysis, the proprietary Enhanced Market Attractiveness Index (EMAI), and an investment risk framework.
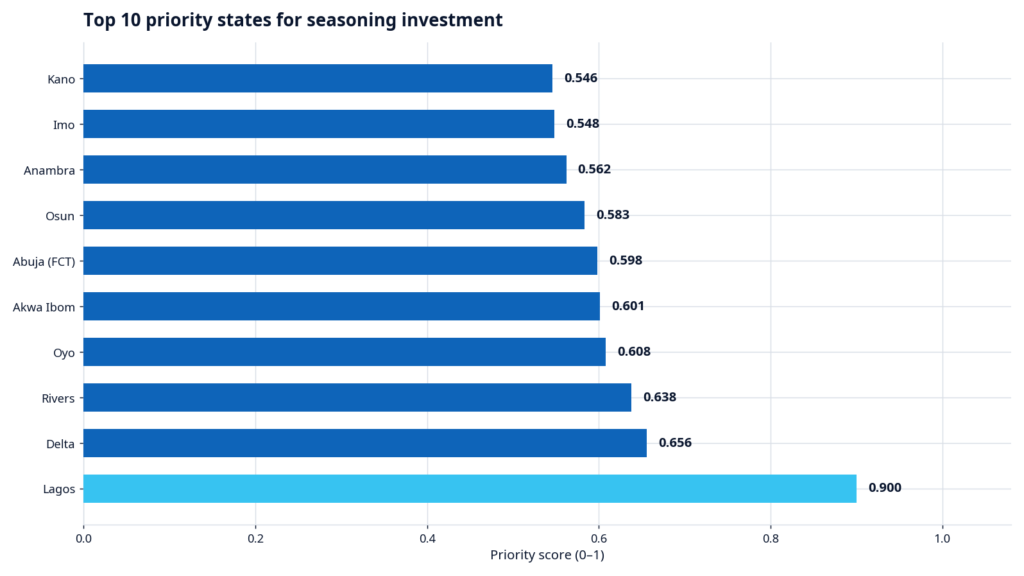
The headline finding: Lagos is Nigeria’s number one priority market for seasoning investment, with a Priority Score of 0.900 — well ahead of Delta (0.656) and Rivers (0.638). The South West and South South should receive 60% of total marketing investment. And the single biggest untapped opportunity is Abuja (FCT), where market attractiveness is 0.719 but penetration is only 54.08%.
At a glance:
- 234.4 million — total population of Nigeria
- 138.6 million — seasoning category users
- 59.1% — national category penetration
- 28.3% — Maggi’s national market share, the leading brand
1. Executive Summary
The Nigerian seasoning category demonstrates robust market fundamentals with significant variation across states and regions. The top three brands — Maggi, Knorr and Mr. Chef — command 53.0% of the market, while the “Other” category at 19.0% shows significant fragmentation among smaller regional and local players.
Priority recommendations
- Immediate focus: Prioritise Lagos, Delta, Rivers, Oyo and Akwa Ibom for immediate market investment and resource allocation.
- Regional strategy: South West and South South should receive 60% of total marketing investment due to high CDI scores (106.1 and 110.3).
- Channel mix: Implement digital-first strategies in South West (70.9% digital reach) while maintaining traditional media dominance in North East (14.5% digital reach).
- Whitespace exploitation: Target Abuja, Ogun and Edo for penetration growth initiatives.
- Competitive defence: Strengthen position against Maggi in high-priority markets through differentiated value propositions.
2. Introduction and Methodology
The Nigerian seasoning market represents one of the most dynamic and competitive consumer goods categories in West Africa. With a population exceeding 234 million people and a growing middle class, the market presents substantial opportunities for both established players and new entrants. This report provides a comprehensive analysis of market attractiveness at both state and regional levels, utilising multiple strategic frameworks to guide investment decisions.
2.1 Research framework
This analysis employs five complementary strategic frameworks to evaluate market opportunities:
- BCG Growth-Share Matrix — The Boston Consulting Group matrix classifies markets based on relative market share and growth rate. Markets are categorised as Stars (high growth, high share), Cash Cows (low growth, high share), Question Marks (high growth, low share), and Dogs (low growth, low share).
- GE McKinsey Matrix — The General Electric/McKinsey matrix evaluates business units against industry attractiveness and competitive strength. This nine-cell matrix provides strategic recommendations ranging from “Invest/Grow” to “Harvest/Divest.”
- CDI-BDI Analysis — The Category Development Index (CDI) measures category penetration relative to the national average, while the Brand Development Index (BDI) measures brand performance relative to the national average. Together, they identify markets where brands underperform or overperform relative to category development.
- Enhanced Market Attractiveness Index (EMAI) — The proprietary EMAI model incorporates five dimensions: market size, growth potential, competition intensity, entry barriers, and profit potential. Each dimension is weighted and normalised to produce a composite score.
- Investment Risk Framework — Risk assessment incorporates crime fatalities, unemployment rates, inflation, and banking access to evaluate market stability and investment safety.
2.2 Data sources and variables
The analysis draws from comprehensive datasets including:
- Demographic data: Population by socioeconomic class, population growth rates.
- Economic indicators: GDP, IGR, GDP per capita, inflation rates, unemployment rates.
- Infrastructure metrics: Internet penetration, banking access, industrial density, vehicle population.
- Trade data: Modern trade presence (retail chains), traditional trade (open markets), trade volumes.
- Media data: Digital media users (Facebook, TikTok, Instagram), traditional media reach (radio, TV, OOH).
- Brand data: User counts for 12 major seasoning brands across all 37 states.
- Risk indicators: Crime fatalities, crime drivers, political stability factors.
3. Market Overview and Category Landscape
The Nigerian seasoning category demonstrates robust market fundamentals with significant variation across states and regions. Understanding this landscape is essential for strategic market entry and expansion decisions.
3.1 National category penetration
The seasoning category achieves a national penetration rate of 59.1%, representing 138.6 million users out of Nigeria’s 234.4 million population. However, this aggregate figure masks significant regional and state-level variations that present both opportunities and challenges.
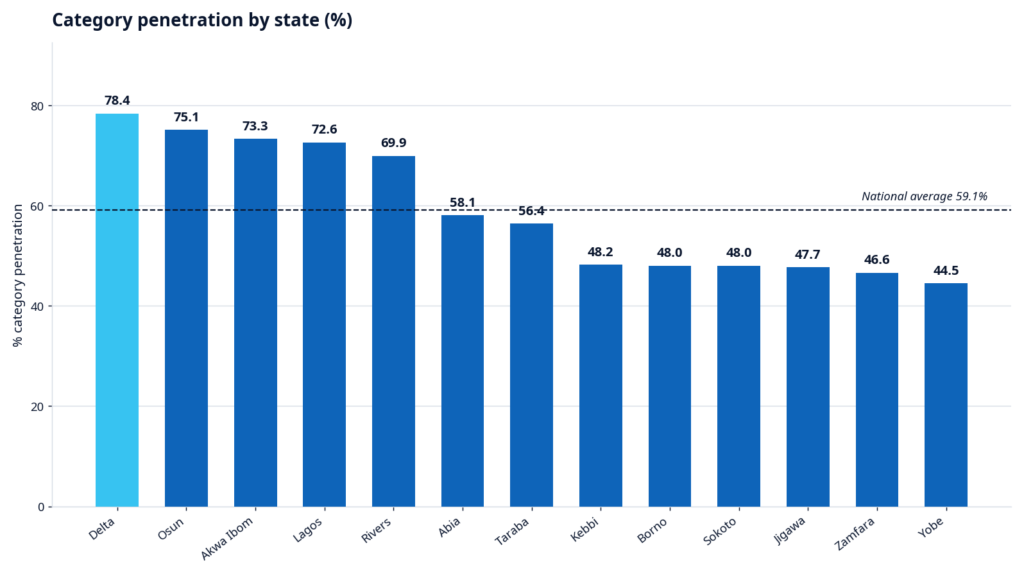
Category penetration ranges from a low of 44.5% in Yobe to a high of 78.4% in Delta State. This 33.9 percentage point spread indicates substantial market maturity differences and corresponding opportunity.
High-penetration markets:
- Delta (78.4%) — highest penetration in the country.
- Osun (75.1%) — strong traditional consumption culture.
- Akwa Ibom (73.3%) — high middle-class population (47.8%).
- Lagos (72.6%) — urban sophistication and diverse culinary traditions.
- Rivers (69.9%) — oil economy supporting purchasing power.
- Abia (58.1%) — industrial base supporting consumption.
Low-penetration markets (below 50%) — seven states show penetration below 50%, representing whitespace opportunities:
- Yobe (44.5%) — security challenges and low literacy (7.2%).
- Jigawa (47.7%) — predominantly rural, low banking access (34.4%).
- Sokoto (48.0%) — traditional consumption patterns.
- Zamfara (46.6%) — security concerns and infrastructure gaps.
- Borno (48.0%) — recovery from insurgency impact.
- Kebbi (48.2%) — agricultural economy with seasonal income.
- Taraba (56.4%) — remote location limiting distribution.
3.2 Brand competitive landscape
The Nigerian seasoning market exhibits a concentrated competitive structure with clear market leaders and a long tail of smaller players.
| Rank | Brand | Total Users | National Share | Top State | BDI |
|---|---|---|---|---|---|
| 1 | Maggi | 39,208,905 | 28.30% | Lagos | 124.9 |
| 2 | Knorr | 23,038,132 | 16.63% | Lagos | 87.2 |
| 3 | Mr. Chef | 11,236,324 | 8.11% | Kano | 175.9 |
| 4 | Royco | 8,716,037 | 6.29% | Lagos | 94.0 |
| 5 | Ajinomoto | 6,608,737 | 4.77% | Kano | 123.3 |
| 6 | Onga | 6,539,941 | 4.72% | Kano | 179.2 |
| 7 | Terra | 5,551,528 | 4.01% | Rivers | 232.9 |
| 8 | Tasty Cubes | 3,969,661 | 2.86% | Lagos | 103.3 |
| 9 | Suppy | 3,404,784 | 2.46% | Osun | 291.0 |
| 10 | Gino | 3,400,423 | 2.45% | Lagos | 156.6 |
| 11 | Dunns Rivers | 590,527 | 0.43% | Kano | 157.5 |
| 12 | Others | 26,301,649 | 18.98% | Lagos | 99.1 |
The top three brands (Maggi, Knorr, and Mr. Chef) command 53.0% of the market, indicating a moderately concentrated market structure. The “Other” category at 19.0% suggests significant fragmentation among smaller regional and local players.
Regional brand preferences — brand performance varies significantly by region, reflecting local preferences, distribution strength, and competitive dynamics:
- South West: Maggi leads with 31.0% share, reflecting strong brand equity in urban centres.
- North West: Mr. Chef achieves 11.3% share, indicating strong performance in Northern markets.
- South South: Mr. Chef captures 9.0% share, outperforming other regions.
- South East: Knorr achieves 20.0% share, competitive with Maggi’s 26.2%.
4. BCG Matrix Analysis
The Boston Consulting Group Growth-Share Matrix provides a strategic framework for portfolio analysis, classifying markets based on relative market share and growth characteristics. This analysis enables resource allocation decisions that balance cash generation with growth investment.
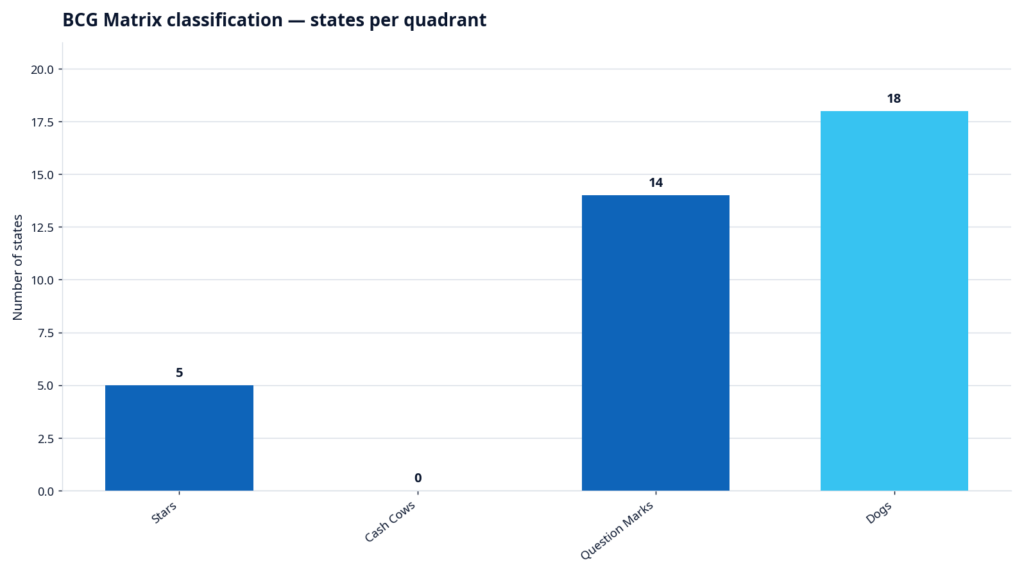
4.1 Stars: High Growth, High Share Markets (5 states)
Star markets combine high relative market share with above-average population growth, representing the most attractive investment opportunities. These markets generate substantial cash flows while maintaining growth momentum.
Strategic implications: Stars require continued investment to maintain market position and fund growth. These five states represent 36.7 million category users (26.5% of national users) and should receive priority resource allocation.
4.2 Cash Cows: Low Growth, High Share Markets (0 states)
No states currently qualify as Cash Cows in the seasoning category. This absence indicates that high-share markets continue to experience growth, suggesting the category has not reached maturity in any significant market.
4.3 Question Marks: High Growth, Low Share Markets (14 states)
Question Mark markets exhibit high growth potential but currently hold low relative market share. These markets require careful evaluation to determine whether investment can convert them into Stars or whether resources should be redirected.
| State | Region | Growth Rate | Relative Share | Recommendation |
|---|---|---|---|---|
| Abuja (FCT) | North Central | 5.68% | 0.12 | High priority – Invest |
| Anambra | South East | 2.58% | 0.27 | Selective investment |
| Bauchi | North East | 2.34% | 0.24 | Monitor |
| Borno | North East | 2.40% | 0.21 | Caution – security risk |
| Delta | South South | 2.41% | 0.34 | Invest – near Star |
| Edo | South South | 2.37% | 0.18 | Selective investment |
| Jigawa | North West | 2.28% | 0.23 | Monitor |
| Katsina | North West | 2.31% | 0.30 | Selective investment |
| Kebbi | North West | 2.27% | 0.12 | Monitor |
| Nasarawa | North Central | 3.35% | 0.13 | High priority – Invest |
| Niger | North Central | 2.35% | 0.22 | Monitor |
| Ogun | South West | 3.05% | 0.41 | Invest – near Star |
| Sokoto | North West | 2.29% | 0.19 | Monitor |
| Yobe | North East | 2.22% | 0.11 | Caution – security risk |
Strategic implications: Question Marks require selective investment. Abuja (FCT), Delta, Ogun, and Nasarawa warrant investment due to favourable market conditions. Borno and Yobe present security risks that may limit investment viability.
4.4 Dogs: Low Growth, Low Share Markets (18 states)
Dog markets exhibit both low growth and low relative share. These markets typically generate limited returns and may warrant harvest or divestment strategies unless they serve strategic purposes such as competitive blocking or distribution efficiency. The 18 Dog markets collectively represent 52.0 million category users (37.5% of national users). While individually less attractive, their aggregate scale warrants consideration for efficiency-focused strategies rather than growth investment.
Key Dog markets by size:
- Akwa Ibom (4.0M users) — high penetration (73.3%) but lower growth (2.11%).
- Imo (3.7M users) — moderate penetration (63.6%) in competitive South East.
- Anambra (3.9M users) — strong market attractiveness (0.503) despite classification.
- Osun (3.6M users) — high penetration (75.1%) with lower growth (1.81%).
Strategic implications: Dog markets should be managed for cash efficiency rather than growth. Maintain presence to serve distribution networks and block competitors, but limit new investment.
5. GE McKinsey Matrix Analysis
The GE McKinsey Matrix extends the BCG framework by evaluating market attractiveness and business strength across multiple dimensions. This multi-factor approach provides more nuanced strategic guidance than the binary BCG classification.
Matrix dimensions — Market Attractiveness incorporates:
| Factor | Weight | What it measures |
|---|---|---|
| GDP per capita | 25% | Economic prosperity indicator |
| Literacy rate | 20% | Consumer sophistication proxy |
| Internet penetration | 20% | Digital readiness |
| Banking access | 20% | Financial inclusion |
| Industrial density | 15% | Economic activity level |
| Trade volume | 15% | Commercial activity |
| Infrastructure score | 10% | Logistics capability |
Strategic classifications:
| Classification | States | Strategic Direction |
|---|---|---|
| Invest/Grow | Lagos | Maximum investment for market leadership |
| Selectivity/Earnings | Abuja (FCT) | Selective investment for profitability |
| Protect/Refocus | None | Defend position, optimise operations |
| Harvest/Divest | 35 States | Manage for cash, limit new investment |
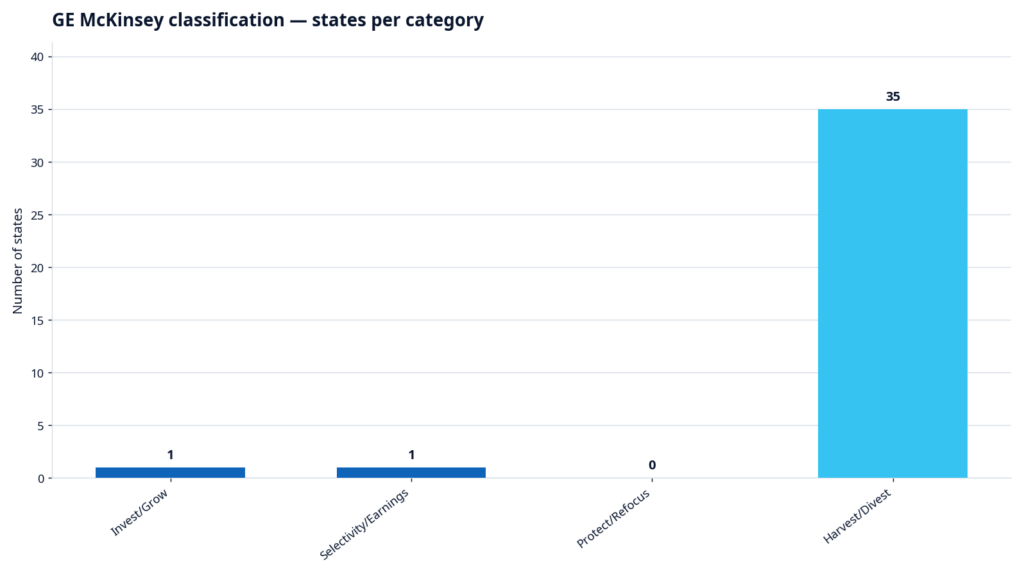
The GE McKinsey analysis reveals a highly concentrated market structure where only Lagos qualifies for “Invest/Grow” status, while Abuja (FCT) falls into “Selectivity/Earnings.” The remaining 35 states are classified as “Harvest/Divest,” indicating that most markets require efficiency-focused rather than growth-focused strategies.
Key insight: The divergence between BCG and GE McKinsey classifications (where 5 states are BCG Stars but only 1 is GE Invest/Grow) highlights the importance of multi-dimensional analysis. Markets like Kano and Rivers have strong user bases but lower scores on market attractiveness dimensions such as internet penetration and banking access.
6. CDI-BDI Analysis by Brand
The Category Development Index (CDI) and Brand Development Index (BDI) framework identifies markets where brands overperform or underperform relative to category development. This analysis guides resource allocation to close performance gaps.
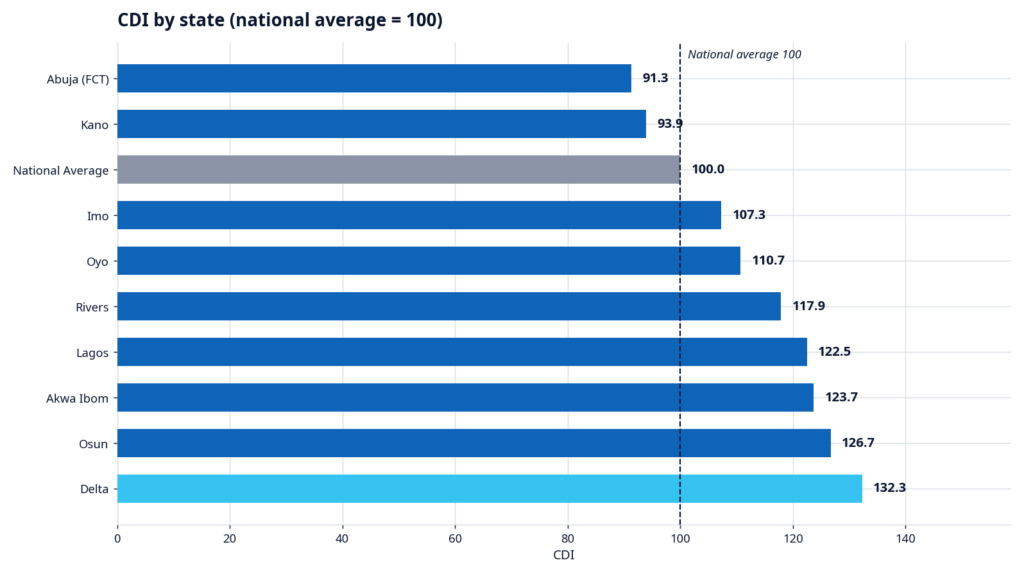
CDI interpretation: The national average CDI is 100. Markets with CDI above 100 show above-average category development, while markets with CDI below 100 show below-average development.
| State | CDI | Category Penetration | Interpretation |
|---|---|---|---|
| Delta | 132.3 | 78.4% | Highly developed market |
| Osun | 126.7 | 75.1% | Highly developed market |
| Akwa Ibom | 123.7 | 73.3% | Highly developed market |
| Lagos | 122.5 | 72.6% | Highly developed market |
| Rivers | 117.9 | 69.9% | Above-average development |
| Oyo | 110.7 | 65.6% | Above-average development |
| Imo | 107.3 | 63.6% | Above-average development |
| National Average | 100.0 | 59.1% | Benchmark |
| Kano | 93.9 | 55.7% | Below-average development |
| Abuja (FCT) | 91.3 | 54.1% | Below-average development |
Brand-specific insights:
- Maggi (market leader): Strong BDI in Lagos (124.9), indicating brand strength in the top market. Opportunity in Kano where BDI (93.9) trails CDI, suggesting underperformance. High BDI in South West region, reflecting strong brand equity.
- Knorr (second place): BDI of 87.2 in Lagos indicates room for growth versus Maggi. Strong performance in South East (20.0% regional share). Opportunity to close gap in North West markets.
- Mr. Chef (third place): Exceptional BDI of 175.9 in Kano, indicating strong Northern market fit. 11.3% share in North West, highest among all brands in that region. Limited presence in Southern markets presents expansion opportunity.
Regional BDI patterns:
- South West: Maggi dominates (31.0% share); international brands preferred.
- North West: Mr. Chef and Onga perform strongly (BDI 175.9 and 179.2 in Kano).
- South South: Terra achieves highest BDI (232.9 in Rivers); regional preference.
- South East: Knorr competitive with Maggi; local brand acceptance.
7. EMAI Model: Enhanced Market Attractiveness Index
The Enhanced Market Attractiveness Index (EMAI) provides a comprehensive evaluation framework incorporating five critical dimensions: market size, growth potential, competition intensity, entry barriers, and profit potential. This proprietary model offers nuanced guidance for market prioritisation.
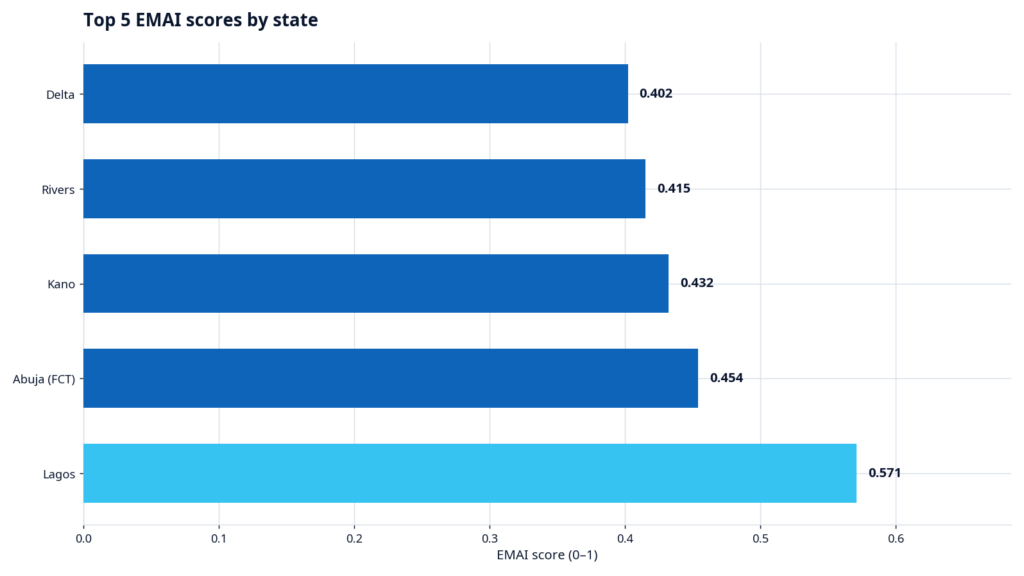
Top EMAI scoring states:
| Rank | State | EMAI Score | Market Size | Growth | Competition | Entry Barriers | Profit Potential |
|---|---|---|---|---|---|---|---|
| 1 | Lagos | 0.571 | 1.000 | 0.852 | 0.583 | 0.417 | 0.970 |
| 2 | Abuja (FCT) | 0.454 | 0.167 | 1.000 | 0.500 | 0.291 | 0.547 |
| 3 | Rivers | 0.415 | 0.547 | 0.690 | 0.417 | 0.107 | 0.720 |
| 4 | Kano | 0.432 | 0.898 | 0.552 | 0.417 | 0.165 | 0.354 |
| 5 | Delta | 0.402 | 0.460 | 0.621 | 0.417 | 0.141 | 0.929 |
Lagos achieves the highest EMAI score (0.571) driven by exceptional market size (1.000), strong growth potential (0.852), and outstanding profit potential (0.970). Abuja (FCT) ranks second despite a smaller user base due to the highest growth rate (5.68%) and favourable entry conditions.
8. Top 10 Priority States
The Priority Score synthesises EMAI, CDI, Market Attractiveness, and Business Strength to identify the states warranting highest investment priority. This composite score balances multiple strategic considerations.
| Rank | State | Region | Priority Score | EMAI | CDI | MAI | BS | Risk | Users | Penetration |
|---|---|---|---|---|---|---|---|---|---|---|
| 1 | Lagos | South West | 0.900 | 0.571 | 122.5 | 0.946 | 0.931 | 0.117 | 10,296,916 | 72.56% |
| 2 | Delta | South South | 0.656 | 0.402 | 132.3 | 0.513 | 0.380 | 0.161 | 4,740,807 | 78.39% |
| 3 | Rivers | South South | 0.638 | 0.415 | 117.9 | 0.563 | 0.390 | 0.153 | 5,631,916 | 69.85% |
| 4 | Oyo | South West | 0.608 | 0.388 | 110.7 | 0.509 | 0.440 | 0.137 | 5,678,953 | 65.56% |
| 5 | Akwa Ibom | South South | 0.601 | 0.348 | 123.7 | 0.496 | 0.315 | 0.157 | 4,040,102 | 73.30% |
| 6 | Abuja (FCT) | North Central | 0.598 | 0.454 | 91.3 | 0.719 | 0.269 | 0.106 | 1,724,876 | 54.08% |
| 7 | Osun | South West | 0.583 | 0.326 | 126.7 | 0.418 | 0.318 | 0.143 | 3,625,148 | 75.08% |
| 8 | Anambra | South East | 0.562 | 0.371 | 102.2 | 0.503 | 0.350 | 0.146 | 3,863,957 | 60.55% |
| 9 | Imo | South East | 0.548 | 0.325 | 107.3 | 0.501 | 0.282 | 0.181 | 3,721,600 | 63.57% |
| 10 | Kano | North West | 0.546 | 0.432 | 93.9 | 0.295 | 0.538 | 0.205 | 9,252,339 | 55.65% |
Priority tier analysis:
- Tier 1 (Priority Score above 0.65): Lagos and Delta represent the highest priority markets. Lagos offers unmatched scale and attractiveness, while Delta provides exceptional category development (CDI 132.3) with lower risk.
- Tier 2 (Priority Score 0.55–0.65): Rivers, Oyo, Akwa Ibom, Abuja (FCT), Osun, and Anambra offer strong investment propositions with varying risk-return profiles. Abuja presents the lowest risk (0.106) but requires penetration growth.
- Tier 3 (Priority Score 0.50–0.55): Imo and Kano round out the top 10. Kano offers massive scale (9.3M users) but higher risk (0.205) and lower market attractiveness.
9. Regional Analysis and Rankings
Nigeria’s six geopolitical regions exhibit distinct market characteristics that require tailored strategies. This analysis provides regional rankings across key metrics.
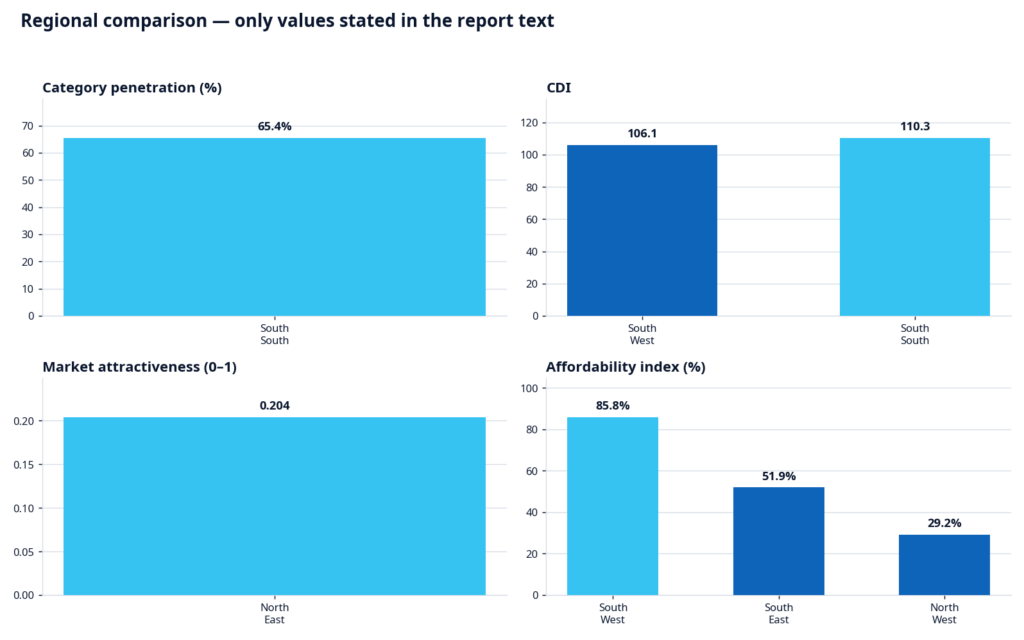
Regional profiles
South West (Rank 1):
- Highest priority score (0.597) with lowest risk (0.137).
- Strong affordability index (85.8%) driven by Lagos, Oyo, Ogun.
- 70.9% digital media reach enables modern marketing approaches.
- 2,607 retail chains support modern trade strategy.
- Recommended: 60% Modern Trade / 40% Traditional Trade.
South South (Rank 2):
- Highest CDI (110.3) indicating strong category development.
- 65.4% penetration, highest among all regions.
- 772 retail chains with significant oil economy support.
- Lower digital reach (39.6%) requires balanced media mix.
- Recommended: 40% Modern Trade / 60% Traditional Trade.
South East (Rank 3):
- Strong entrepreneurial culture with 390 major open markets.
- Moderate affordability (51.9%) with significant variation.
- Security concerns (separatist activity) elevate risk.
- Knorr competitive with Maggi, indicating brand openness.
- Recommended: 40% Modern Trade / 60% Traditional Trade.
North Central (Rank 4):
- Abuja (FCT) drives regional attractiveness.
- 1,089 retail chains, second only to South West.
- 62.0% digital reach enables modern marketing.
- Moderate risk (0.220) with security concerns in some states.
- Recommended: 50% Modern Trade / 50% Traditional Trade.
North West (Rank 5):
- Largest population (64.4M) but lowest affordability (29.2%).
- Mr. Chef and Onga achieve highest BDIs; local preference.
- Limited digital reach (17.2%) requires traditional focus.
- Highest risk (0.304) due to banditry and security issues.
- Recommended: 20% Modern Trade / 80% Traditional Trade.
North East (Rank 6):
- Recovery from insurgency impact limits market development.
- Lowest market attractiveness (0.204) and business strength (0.196).
- Limited infrastructure (199 retail chains, lowest).
- Traditional media dominance (14.5% digital reach).
- Recommended: 20% Modern Trade / 80% Traditional Trade.
10. Category Whitespace Opportunities
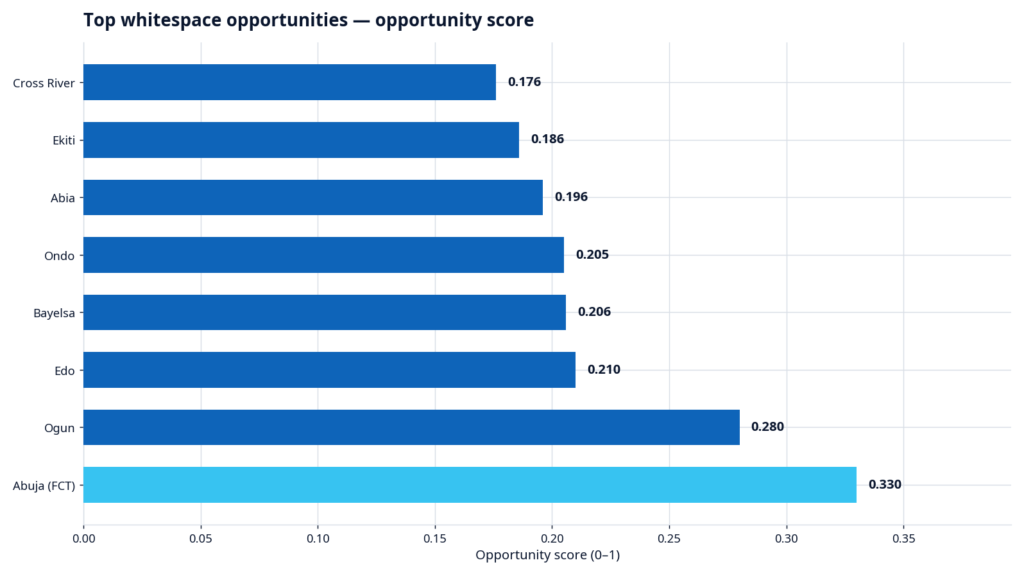
Whitespace opportunities represent markets with high attractiveness but below-potential penetration. These markets offer the highest return on investment for penetration growth initiatives.
| Rank | State | Opportunity Score | Market Attractiveness | Current Penetration | Gap | Strategy |
|---|---|---|---|---|---|---|
| 1 | Abuja (FCT) | 0.330 | 0.719 | 54.08% | 45.92% | Urban activation |
| 2 | Ogun | 0.280 | 0.577 | 51.45% | 48.55% | Industrial corridor |
| 3 | Edo | 0.210 | 0.480 | 56.14% | 43.86% | Trade hub leverage |
| 4 | Bayelsa | 0.206 | 0.467 | 55.85% | 44.15% | Oil economy focus |
| 5 | Ondo | 0.205 | 0.458 | 55.23% | 44.77% | Cocoa belt expansion |
| 6 | Abia | 0.196 | 0.469 | 58.14% | 41.86% | Industrial zone |
| 7 | Ekiti | 0.186 | 0.434 | 57.19% | 42.81% | Education sector |
| 8 | Cross River | 0.176 | 0.425 | 58.68% | 41.32% | Tourism corridor |
Whitespace strategy framework
Abuja (FCT) — Priority 1: Highest opportunity score (0.330) with exceptional market attractiveness (0.719). 94 open market hubs and 421 retail chains provide distribution infrastructure. 83.2% internet penetration enables digital-first activation. 54.7% affordability index supports premium positioning. Strategy: urban lifestyle marketing, modern trade focus, premium SKUs.
Ogun — Priority 2: 3.05% population growth, highest in South West. 89.0% affordability index with industrial corridor (Ota, Sagamu). Proximity to Lagos enables spillover marketing. Strategy: industrial worker targeting, trade route activation.
Edo — Priority 3: 76 open market hubs with significant trade volume. 86.0% affordability index supports growth. Benin City as regional distribution centre. Strategy: trade hub dominance, regional expansion base.
11. Channel Mix Strategy
Effective channel strategy requires alignment between trade channels and media channels, tailored to regional characteristics. This analysis provides evidence-based recommendations for channel mix optimisation.
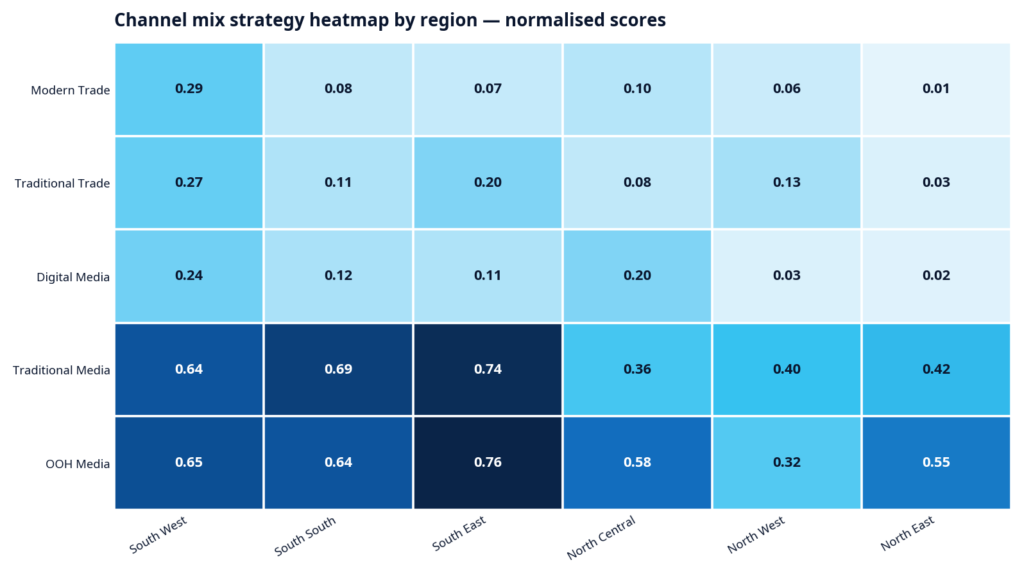
Trade channel strategy and media channel strategy:
| Region | Digital Reach | Traditional Reach | Recommended Mix |
|---|---|---|---|
| South West | 70.9% | 145.9% | 50% Digital / 35% TV-Radio / 15% OOH |
| South South | 39.6% | 151.5% | 35% Digital / 45% TV-Radio / 20% OOH |
| South East | 37.3% | 157.4% | 35% Digital / 45% TV-Radio / 20% OOH |
| North Central | 62.0% | 115.1% | 50% Digital / 35% TV-Radio / 15% OOH |
| North West | 17.2% | 119.3% | 20% Digital / 60% TV-Radio / 20% OOH |
| North East | 14.5% | 122.2% | 20% Digital / 60% TV-Radio / 20% OOH |
Channel integration recommendations
South West — digital-first approach:
- Leverage 70.9% digital reach with social media campaigns.
- Instagram and TikTok for younger demographics.
- Modern trade partnerships for premium positioning.
- OOH in Lagos, Ibadan, Abeokuta for mass reach.
North West — traditional focus:
- Radio dominates with 119.3% reach — primary channel.
- TV for evening family viewing.
- Open market activations for trial and sampling.
- Limited digital investment due to 17.2% reach.
Key distribution insights:
- Lagos: 214 open market hubs, 1,447 retail chains — dual strategy essential.
- Kano: 188 open market hubs, 239 retail chains — traditional trade dominant.
- Abuja: 94 open market hubs, 421 retail chains — modern trade opportunity.
- Anambra: 142 open market hubs — entrepreneurial trade culture.
12. Investment Risk Analysis
Risk assessment is critical for market prioritisation, particularly in a diverse market like Nigeria where security, economic, and infrastructure risks vary significantly by region.
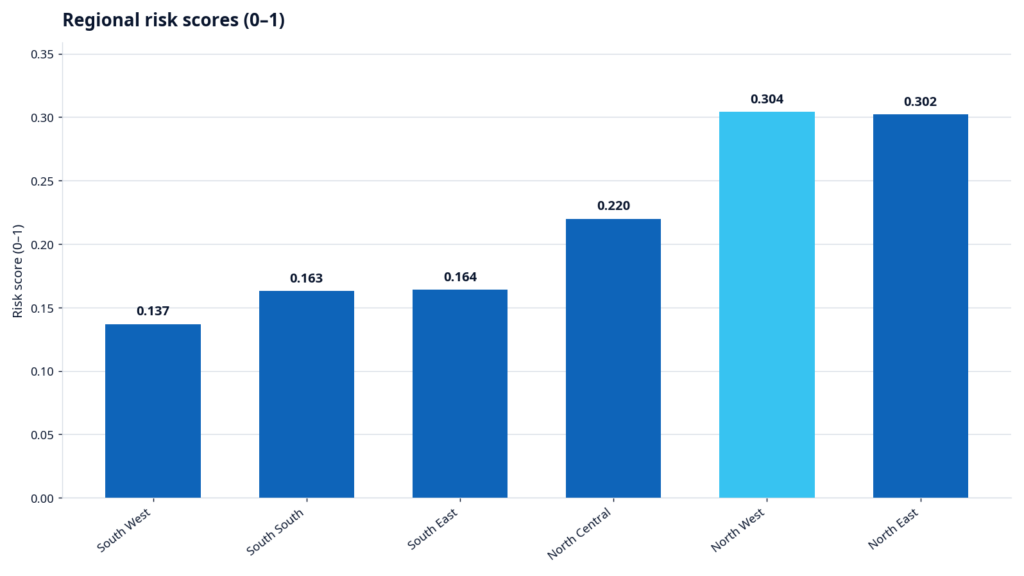
Risk score components:
| Factor | Weight | Description |
|---|---|---|
| Crime Fatalities | 30% | Security incidents per state |
| Unemployment Rate | 25% | Economic stability indicator |
| Inflation Rate | 25% | Purchasing power erosion |
| Banking Access | 20% | Financial infrastructure (inverse) |
Regional risk profile:
| Region | Risk Score | Primary Risk Factors | Investment Stance |
|---|---|---|---|
| South West | 0.137 | Property crime (Lagos) | Low Risk — Invest |
| South South | 0.163 | Cultism, kidnapping | Low Risk — Invest |
| South East | 0.164 | Separatist activity | Moderate Risk — Selective |
| North Central | 0.220 | Communal clashes | Moderate Risk — Selective |
| North West | 0.304 | Banditry, terrorism | High Risk — Caution |
| North East | 0.302 | Insurgency | High Risk — Caution |
State-level risk assessment:
Lowest risk states (score below 0.15):
- Abuja (FCT): 0.106 — political capital, strong security.
- Lagos: 0.117 — economic hub, relatively stable.
- Oyo: 0.137 — political stability, economic activity.
- Osun: 0.143 — low crime, peaceful environment.
- Anambra: 0.146 — commercial activity despite security concerns.
Highest risk states (score above 0.25):
- Borno: 0.352 — terrorist insurgency impact.
- Zamfara: 0.338 — banditry, cattle rustling.
- Katsina: 0.314 — banditry spillover.
- Yobe: 0.312 — insurgency, limited infrastructure.
- Sokoto: 0.301 — banditry, terrorism.
Risk-adjusted investment strategy:
- Low-risk markets: Full investment, expansion initiatives.
- Moderate-risk markets: Selective investment, partner with local distributors.
- High-risk markets: Maintain presence, limit new investment, focus on cash efficiency.
13. Growth Hack Opportunities
Growth hack opportunities represent markets with favourable conditions for rapid penetration growth through targeted interventions. These markets combine population growth, penetration gaps, affordability, and digital readiness.
Growth Hack Score components:
- Population Growth Rate (25%) — future market expansion.
- Penetration Gap (25%) — room for growth.
- Affordability Index (25%) — purchasing power.
- Internet Penetration (25%) — digital activation potential.
| Rank | State | Growth Hack Score | Pop Growth | Penetration Gap | Affordability | Internet | Strategy |
|---|---|---|---|---|---|---|---|
| 1 | Ogun | 0.538 | 3.05% | 48.55% | 89.0% | 74.5% | Digital activation |
| 2 | Lagos | 0.532 | 3.24% | 27.44% | 94.7% | 87.4% | Premium expansion |
| 3 | Oyo | 0.484 | 2.45% | 34.44% | 88.5% | 68.2% | Urban-rural bridge |
| 4 | Abuja (FCT) | 0.474 | 5.68% | 45.92% | 54.7% | 83.2% | Urban lifestyle |
| 5 | Edo | 0.468 | 2.37% | 43.86% | 86.0% | 54.8% | Trade hub leverage |
| 6 | Anambra | 0.460 | 2.58% | 39.45% | 82.6% | 59.2% | Entrepreneur focus |
| 7 | Delta | 0.444 | 2.41% | 21.61% | 92.9% | 60.5% | Premium positioning |
| 8 | Ondo | 0.442 | 2.05% | 44.77% | 85.3% | 44.6% | Agro-allied |
| 9 | Rivers | 0.428 | 2.76% | 30.15% | 72.0% | 66.1% | Oil economy |
| 10 | Kwara | 0.403 | 1.88% | 37.95% | 76.2% | 45.3% | Central hub |
Growth hack strategies by state
Ogun — digital-first activation:
- 74.5% internet penetration enables social media campaigns.
- Industrial corridor (Ota, Sagamu) for B2B activation.
- Proximity to Lagos for spillover marketing.
- Recipe content on TikTok and Instagram.
- Influencer partnerships with food bloggers.
Abuja (FCT) — urban lifestyle marketing:
- 5.68% population growth, highest nationally.
- Civil service and diplomatic community targeting.
- Modern trade partnerships (421 retail chains).
- Premium product positioning.
- Corporate gifting programs.
Anambra — entrepreneurial ecosystem:
- 142 open market hubs — highest in South East.
- Trader community engagement.
- Onitsha market activation.
- Nollywood partnership opportunities.
- Regional distribution hub strategy.
14. Infrastructure and Market Readiness
Infrastructure readiness directly impacts market entry feasibility, distribution efficiency, and marketing effectiveness. This analysis evaluates key infrastructure dimensions across states and regions.
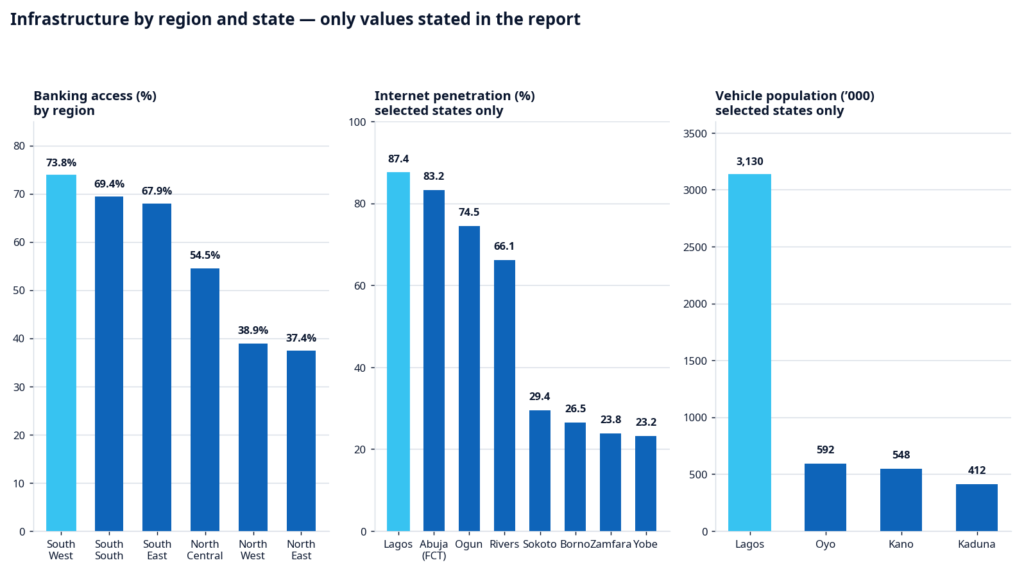
Digital infrastructure
Internet penetration leaders:
- Lagos: 87.4% — enables full digital marketing stack.
- Abuja (FCT): 83.2% — government and corporate digital adoption.
- Ogun: 74.5% — industrial corridor connectivity.
- Rivers: 66.1% — urban digital infrastructure.
Internet penetration laggards:
- Yobe: 23.2% — limited infrastructure investment.
- Borno: 26.5% — security challenges limiting investment.
- Zamfara: 23.8% — rural predominance.
- Sokoto: 29.4% — traditional economy.
Financial infrastructure
Banking access is critical for modern trade development and digital payment adoption:
- High access (above 70%): South West (73.8%), South South (69.4%), South East (67.9%).
- Medium access (50–70%): North Central (54.5%).
- Low access (below 50%): North West (38.9%), North East (37.4%).
Logistics infrastructure
Vehicle population and airport infrastructure indicate logistics capability:
- Lagos: 3.13M vehicles, 2 airports — national logistics hub.
- Kano: 548K vehicles, 1 airport — Northern distribution centre.
- Oyo: 592K vehicles, 1 airport — regional hub.
- Kaduna: 412K vehicles, 2 airports — central corridor.
Market readiness summary:
| Readiness Level | States | Characteristics | Strategy |
|---|---|---|---|
| High | Lagos, Abuja, Ogun, Rivers, Delta | Digital ready, strong logistics | Full modern marketing |
| Medium-High | Oyo, Osun, Ekiti, Ondo, Edo | Good infrastructure, developing | Hybrid approach |
| Medium | Kwara, Plateau, Niger, Kogi | Limited digital, good logistics | Traditional focus |
| Low-Medium | Kano, Kaduna, Katsina | Traditional economy, security | Trade-focused |
| Low | Borno, Yobe, Zamfara | Limited infrastructure, security | Presence only |
15. Summary of Findings and Recommendations
This comprehensive analysis of Nigeria’s seasoning category reveals a market of significant scale and complexity, with clear opportunities for strategic growth. The following summary distils key findings into actionable recommendations.
1. Market prioritisation framework
| Priority Tier | States | Investment Level | Strategy Focus |
|---|---|---|---|
| Tier 1 | Lagos, Delta, Rivers | High (40% of budget) | Market leadership |
| Tier 2 | Oyo, Akwa Ibom, Abuja, Osun | Medium-High (30%) | Growth acceleration |
| Tier 3 | Anambra, Imo, Kano, Kaduna | Medium (20%) | Position defense |
| Tier 4 | Remaining 26 states | Low (10%) | Presence maintenance |
2. Regional investment allocation
Based on the comprehensive analysis, recommended regional investment allocation:
- South West (35%): Digital-first, modern trade focus, premium positioning.
- South South (25%): Balanced approach, oil economy targeting, trade hub leverage.
- South East (15%): Entrepreneurial focus, open market activation.
- North Central (15%): Abuja-centric, urban activation.
- North West (7%): Traditional trade, local brand competition.
- North East (3%): Presence only, partner-dependent.
3. Channel strategy by region
- South West: 60% Modern Trade, 50% Digital Media.
- South South: 60% Modern Trade, 35% Digital Media.
- South East: 40% Modern Trade, 35% Digital Media.
- North Central: 50% Modern Trade, 50% Digital Media.
- North West: 20% Modern Trade, 20% Digital Media.
- North East: 20% Modern Trade, 20% Digital Media.
4. Competitive strategy
- Vs. Maggi: Differentiate on local taste profiles, value positioning.
- Vs. Knorr: Leverage digital channels where Knorr underperforms.
- Vs. Mr. Chef: Defend South, expand North with adapted positioning.
- Vs. regional players: Acquire or partner for distribution access.
5. Growth initiatives
- Whitespace penetration: Target Abuja, Ogun, Edo for 10-point penetration gain.
- Digital activation: Scale social media in South West and North Central.
- Trade expansion: Increase modern trade coverage in Tier 1 and 2 states.
- Premium segmentation: Launch premium SKUs in high-affordability markets.
- Recipe marketing: Content-led engagement on TikTok and Instagram.
6. Risk mitigation
- Security risk: Limit direct investment in Borno, Yobe, Zamfara.
- Distribution risk: Partner with established distributors in high-risk regions.
- Competitive risk: Monitor Mr. Chef expansion in Northern markets.
- Economic risk: Maintain value-tier offerings for inflation protection.
7. Implementation roadmap
| Phase | Timeline | Focus | Key Actions |
|---|---|---|---|
| Phase 1 | Q1–Q2 2026 | Foundation | Lagos, Delta, Rivers intensification |
| Phase 2 | Q3–Q4 2026 | Expansion | Oyo, Akwa Ibom, Abuja rollout |
| Phase 3 | Q1–Q2 2027 | Whitespace | Ogun, Edo, Anambra penetration |
| Phase 4 | Q3–Q4 2027 | Optimisation | Performance review, reallocation |
16. References
- National Bureau of Statistics (2025). Nigerian GDP Report Q4 2024. Abuja: NBS Publications.
- Nigerian Communications Commission (2025). Industry Statistics Report 2024. Abuja: NCC.
- Central Bank of Nigeria (2025). Financial Inclusion Report 2024. Abuja: CBN.
- National Population Commission (2025). Nigeria Population Estimates 2024. Abuja: NPC.
- Boston Consulting Group (2024). The Growth-Share Matrix: Theory and Practice. Boston: BCG Publications.
- McKinsey & Company (2024). Strategic Portfolio Analysis: The GE-McKinsey Matrix. New York: McKinsey Insights.
- Kotler, P., & Keller, K. L. (2023). Marketing Management (16th ed.). Pearson Education.
- Aaker, D. A. (2023). Strategic Market Management (12th ed.). Hoboken, NJ: Wiley.
- Nigerian Investment Promotion Commission (2025). State-Level Investment Profiles 2024. Abuja: NIPC.
- Federal Ministry of Agriculture (2025). Food Processing Industry Report 2024. Abuja: FMA.
- Nielsen Nigeria (2025). Consumer Goods Category Report: Seasonings. Lagos: Nielsen.
- FSN (2025). Nigeria Media Facts and Figures 2024. Lagos: FSN.
- World Bank (2025). Nigeria Economic Update 2024. Washington, DC: World Bank Group.
- International Monetary Fund (2025). Nigeria: Article IV Consultation Report. Washington, DC: IMF.
- African Development Bank (2025). Nigeria Country Strategy Paper 2024–2028. Abidjan: AfDB.
See our Services page for the six integrated disciplines behind this approach.
Frequently asked questions
What is the Market Attractiveness Index (MAI)?
The Market Attractiveness Index is Mediology Nigeria’s framework for ranking markets for seasoning category investment. It synthesises the Enhanced Market Attractiveness Index (EMAI), the Category Development Index (CDI), market attractiveness and business strength into a single Priority Score for each of Nigeria’s 37 states, so brands can see at a glance where investment will pay best.
How is the MAI Priority Score calculated?
The Priority Score synthesises four inputs — EMAI, CDI, Market Attractiveness, and Business Strength — into one composite score. The EMAI itself is built from five dimensions: market size, growth potential, competition intensity, entry barriers and profit potential, each weighted and normalised. Lagos scores highest at 0.900; Delta follows at 0.656.
What do the scores mean — what makes a state a priority?
A higher Priority Score means a stronger balance of scale, growth, category development and profit potential against risk. Tier 1 states (score above 0.65) are Lagos and Delta; Tier 2 (0.55–0.65) includes Rivers, Oyo, Akwa Ibom, Abuja, Osun and Anambra; Tier 3 (0.50–0.55) covers Imo and Kano. Risk is scored separately — Abuja is the lowest-risk state at 0.106, while Borno is the highest at 0.352.
How should a seasoning brand use this report?
Use the Priority Score to decide where to invest first, the whitespace analysis to find penetration growth (Abuja, Ogun and Edo lead), the channel mix tables to match media and trade to each region — digital-first in the South West, traditional media in the North East — and the risk analysis to size investment to each market’s security and economic conditions.
Where can I get the full report?
The full 25-page Seasoning Market Attractiveness Index (MAI) Report 2026 is available to download below. For a tailored reading of the findings for your brand, or a state-level deep dive, contact Mediology Nigeria at info@mediologyng.com or visit 1 Montgomery Road, Yaba, Lagos.
This report was prepared by Jim Ikpehai, Mediology Nigeria — data-driven marketing communications excellence. For the full analysis, including every state ranking and the underlying data, download the complete report below.